Planify Feed

Date: Fri 31 Jul, 2026
Zepto's road to the stock market just got a detour. The quick commerce company has decided to lay aside its IPO plans for the time being and is instead lining up a pre-IPO round of more than ₹1,000 crore, according to reports citing people familiar with the matter.
The money is expected to come largely from names already on Zepto's cap table. Glade Brook Capital, General Catalyst, Goodwater Capital, and Nexus Venture Partners are all said to be in the mix. There's some disagreement in reports about whether this will be a purely domestic affair or include foreign investors too, but the broader picture is clear: this is existing money coming back in, not new investors being courted. SEBI rules allow companies to raise up to 20% of their proposed fresh issue this way, with whatever's raised getting adjusted against the IPO's fresh issue later.
So why the sudden change of plan? It really comes down to money, specifically how much Zepto is actually worth.
Institutional investors, mutual funds and insurers among them, have apparently been pushing back hard on valuation. Word is they're valuing the company somewhere between $2.5 and 3 billion, which is a pretty brutal haircut from where things stood just weeks earlier, when foreign institutional investors were reportedly working off a $4.5 billion pre-money number, pointing to something like $5.1 billion post-money.
Go back further and the gap looks even wider. Fund managers are said to be holding out for pricing 30-40% below Zepto's last valuation of $7 billion, set when the company raised $450 million back in October 2025. Part of the resistance, apparently, is that investors don't think Zepto should be priced in the same league as Swiggy or Eternal (Zomato's parent). Unlike those two, Zepto has no food delivery arm, it's quick commerce only, so the comparison doesn't quite hold up in their eyes.
None of this is entirely new territory for Zepto. The company first talked about going public back in 2025 but backed off when markets turned choppy and the valuation math got messy. Since then, it's done the groundwork you'd expect from a company serious about listing, moving its base from Singapore to India and building up its domestic shareholding, and had even gotten as far as receiving SEBI's observation letter on May 8.
For now though, that process is on ice. Zepto hasn't responded to questions about the fundraise, its valuation, or when, or if, the IPO timeline gets revived.
Date: Thu 30 Jul, 2026
India holds somewhere between ₹50–60 lakh crore of household wealth in gold. Weddings, festivals, emergencies — for generations, that wealth has moved through jewellers, chits and hand-written ledgers, with almost no digital infrastructure behind it.
India Gold Metaverse (IGM) is trying to build that missing infrastructure. Despite the name, there's no VR headset involved — it's four connected businesses:
- Elanzia — a marketplace linking jewellers and bullion dealers
- RamMudra — blockchain-backed digital gold and coins
- GoldSense — an AI-based purity-verification engine
- BullionX — an institutional trading and settlement platform
Revenue is meant to come from commissions, trading spreads, vaulting fees, software licensing and gold-backed lending — an ecosystem play, not a single product. The company is mentored by Jignesh Shah, founder of 63 Moons, a name with real weight in Indian exchange-building circles.
Then came the headline: ₹300 crore raised, with marquee names attached — Ashish Kacholia, along with the Jagdish Master, Waaree, Ravi Sheth and Anuj Sheth family offices, in a transaction run by Pantomath. For an unlisted company with sub-₹10 crore revenue, that's a very loud number. So it's worth checking against the paper trail.
What the filing actually shows
Every Indian company issuing new shares has to file Form PAS-3 with the Registrar of Companies — and that filing doesn't do adjectives. IGM's PAS-3, for an allotment dated 2 May 2026, shows:
Particulars | Detail |
|---|---|
Shares allotted | 9,56,70,628 |
Nominal value | ₹1 |
Premium | ₹20 |
Issue price | ₹21 per share |
Amount raised | ₹200.91 crore |
Not ₹300 crore. ₹200.91 crore, at ₹21 a share.
That's not a contradiction — it's a timing gap, and there are two straightforward reasons for it. One, MCA filings run on their own clock. Large rounds are routinely allotted in tranches, each with its own PAS-3 filed weeks later. IGM has already expanded its authorised capital from ₹108 crore to ₹153 crore, well beyond what's been issued so far — a sign it's making room for more allotments. Two, an announcement isn't a wire transfer. Round sizes get declared when terms are signed; the cash can follow over months. So the ₹300 crore figure is very likely genuine — it's just not yet fully verifiable, which is different from being untrue.
The number that actually deserves attention: price, not size
Three prices exist for the same stock, within weeks of each other:
Reference | Price per share |
|---|---|
Registered valuer's fair value (29 Mar 2026) | ₹19.50 |
Price paid by anchor investors (May 2026 allotment) | ₹21.00 |
Current indicative unlisted market price | ₹25.00 |
Kacholia and the family offices came in at ₹21. The unlisted market today is quoting ₹25 — a 19% premium over what the informed, anchor money paid, and a 28% premium over the independent valuer's fair value, in the space of a few weeks.
Sometimes that kind of premium is earned — smart money moves early and the market re-rates around it. Sometimes it's simply the cost of arriving after the story has already been packaged and sold.
Running the scale math
- Paid-up capital before the round: ₹92.10 crore (92.10 crore shares)
- New shares issued: 9.57 crore → roughly 9.4% dilution
- Post-money at the round price of ₹21: ~₹2,135 crore
- Implied market cap at the unlisted price of ₹25: ~₹2,542 crore
If the full ₹300 crore eventually lands at ₹21, dilution rises to roughly 13.5% and post-money moves to about ₹2,234 crore. Either way, the unlisted market is currently pricing in close to ₹400 crore of value that no investor in this actual round paid for.
A two-and-a-half-year-old company, still building, with revenue that barely registers — which is normal for infrastructure at this stage. It just means investors buying at ₹25 in the unlisted market are paying a ~₹2,500 crore valuation for a plan, in a market with no daily price discovery and lot sizes as small as 5,000 shares.
The takeaway
There's a genuine thesis here: India's gold trade is fragmented, under-digitised, and enormous in scale, and the people backing IGM are far from naive. But in the unlisted market, the story almost always arrives before the paperwork — and that gap is exactly where retail investors tend to get priced badly.
Three checks worth applying to any unlisted "mega-round" headline:
- How much has actually landed, not how much was announced — tranches are normal, but assuming they're all in is not.
- What price the informed money paid, not the price you're being quoted today.
- Wait for the filing. PAS-3 doesn't do storytelling — press releases do.
As of now, what's verifiable is ₹200.91 crore, at ₹21 per share, allotted 2 May 2026, on record with the MCA. The rest is announcement, not confirmation — and if it shows up in a later filing, that's worth tracking, not assuming.
Date: Wed 29 Jul, 2026
At each scanning session for patients in an MRI machine, when a semiconductor wafer is being etched, and also at the drawing of optical fiber cables, helium at -269°C is used to ensure that all machines work efficiently. India does not produce any commercial helium at all and all of it is imported. The fact is that commercial helium occurs only in a few places on the planet (for example, in Texas, Qatar, Algeria, and Canada). And it is five companies worldwide who monopolize 80% of total helium production. AirLife Gases Private Limited was founded by Kiran Karnawat, an industry veteran, to address the problem of India's dependence on helium supplies.
Key Pivot: Major Strategic M&A Moves
While AirLife’s success has been driven by the business model of arbitrage on the basis of sourcing and logistics, its recent bold move in M&A has completely transformed the future of the business:
- Acquisition of Royal Helium Ltd. (Canada): From October through November 2025, AirLife became involved in a significant fundraise round and completed the acquisition of a 52.9% controlling stake in Royal Helium Ltd., a Canadian E&P company with helium rights covering southern Saskatchewan and southeastern Alberta.
- Acquisition of GNG Infrastructure (US): In July 2026, AirLife entered into a definitive deal for the acquisition of a controlling stake in GNG, a helium gathering, processing, and liquefaction infrastructure company in the United States.
Within one year, AirLife has gone from being a middleman distributor to being fully vertically integrated as an upstream helium producer – owning everything from the reservoir to the liquefaction and transport process.
The Truth Behind the Financials & Fundraising
The pivot of strategy at AirLife won it much praise, raising about ₹143.5 crore between April and September 2025 at ₹900 per share. The marquee backers involved were Ashish Kacholia (who wrote a ₹15 crore check), Shiv Sehgal, and Neo Alternatives, giving it a post-money valuation of ₹958 crore. On the post-money ₹958 crore against FY25 PAT of ₹12.5 crore, P/E is closer to 77x.
FY25 Revenue was ₹183 crore (down 3% from ₹188 crore in FY24), showing stagnation in the top line in recent years. The operating margin fell from 26.4% in FY23 (due to the global helium shortage) to 8.6% in FY24 (when Russian supply came back into Asian markets) before inching up to 10.9% in FY25 with ₹12.5 crore PAT in FY25. At ₹900 per share, AirLife is trading at around 65x FY25 P/E multiple and an EV/EBITDA multiple in the mid-40s. The valuation of this fundraise depends greatly on optimistic internal forecasts (revenue in FY26 at ₹412 crore) and terminal multiples beyond FY30.
Conclusion
The demand for helium in India in the spheres of medicine, aerospace and technology has been growing, and its recent M&A activity solves the problem of molecule security by becoming a major supplier of the product. Nevertheless, entering upstream operations entails a great deal of execution, geological and recommissioning risks. The current market valuation of AirLife, at 65 times historical earnings, clearly speaks to the future rather than past success.
Date: Wed 29 Jul, 2026
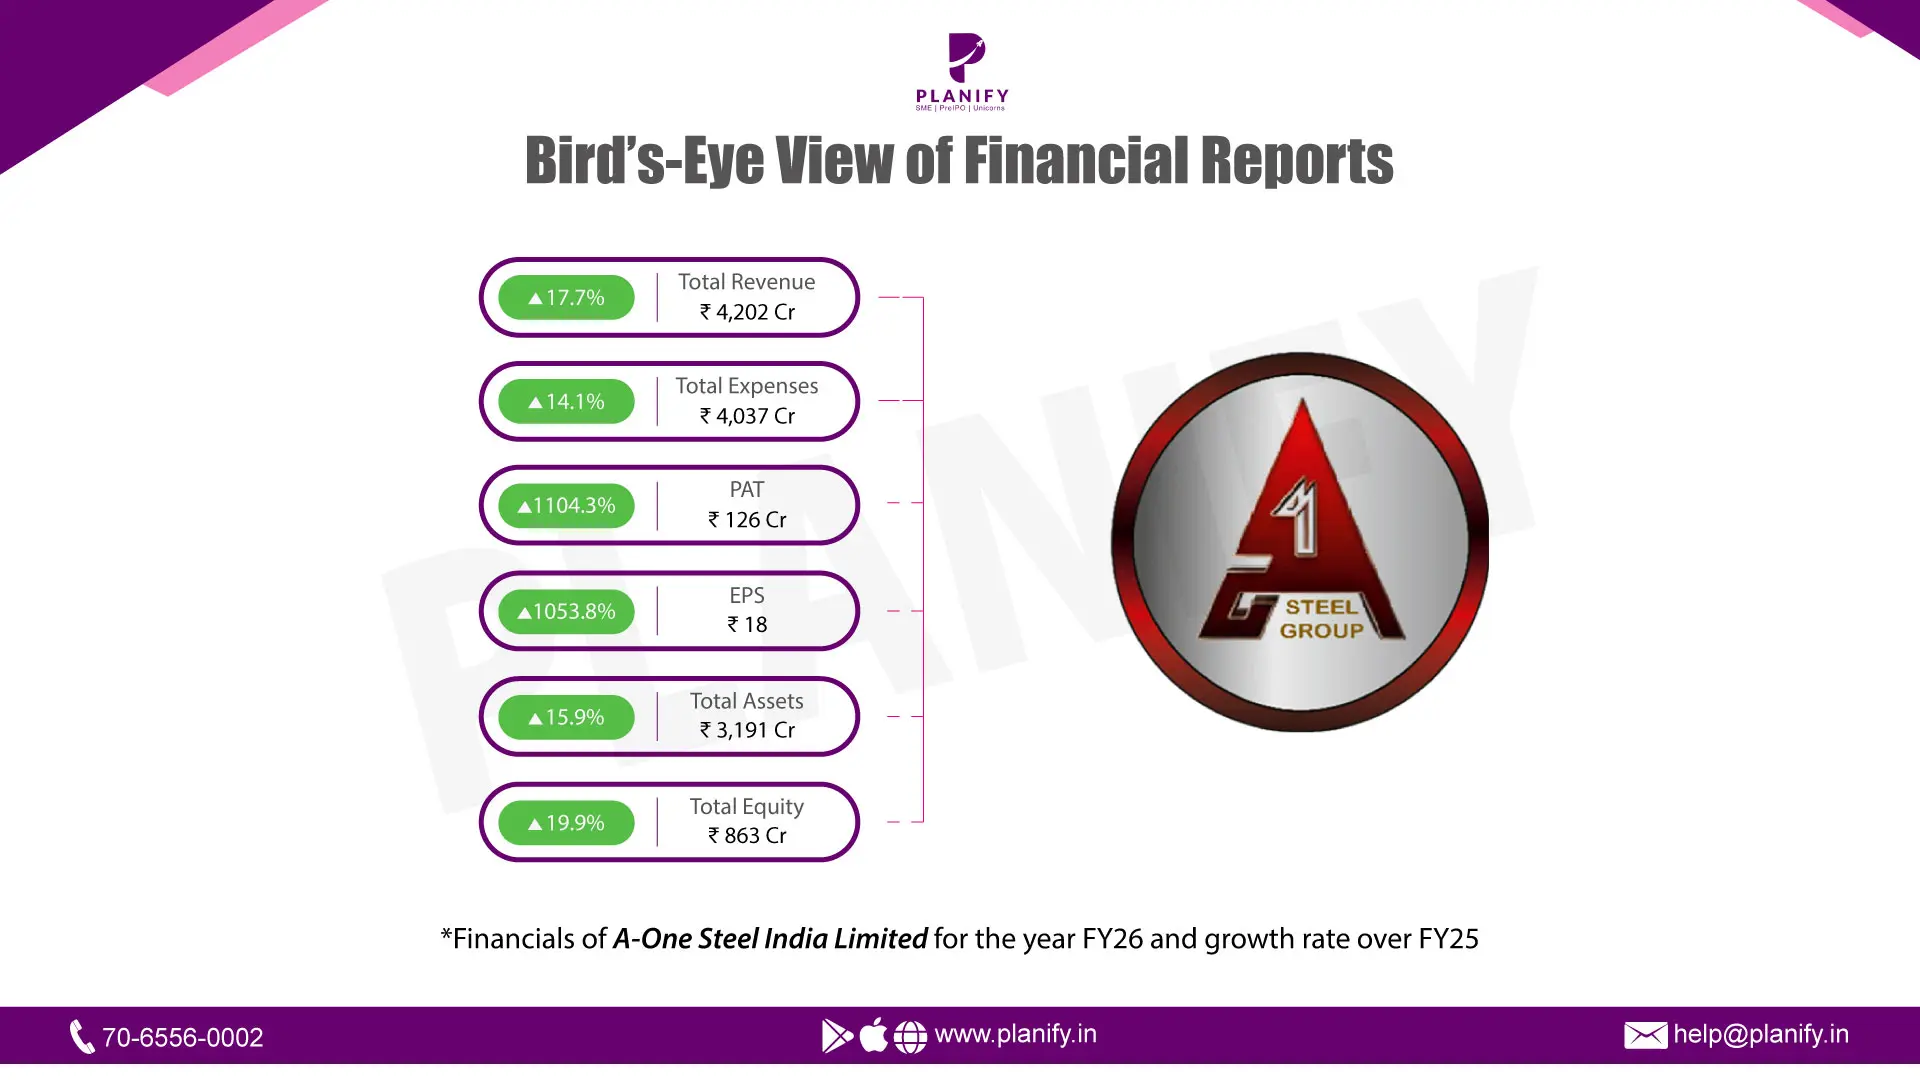
A- One Steel India Ltd. was established in 2009 under the vision of Mr. Krishan Kumar Jallan. It is a backwards-integrated steel manufacturing company in southern India with a diversified product portfolio in both long and flat steel products and industrial products used in steel manufacturing. The company has a total installed capacity of 1.497 million metric tonnes per annum. The company is one of the top 5 (five) steel producers in southern India in terms of crude steel capacity.
A-One Steel have six manufacturing facilities of which five are located in Karnataka and one in Andhra Pradesh. Company's manufacturing facilities are located at Gauribidanur, Bellary, Koppal, and Chikkantapur in Karnataka and Hindupur in Andhra Pradesh.
A- One Steel India has published its performance for the financial year 2026.FY26 was a strong turnaround year for the company: revenue grew ~17.7% to ₹4,202 Cr, while EBITDA and net profit grew far faster (+70% and over 11x, respectively), driving a marked improvement in margins and return ratios.
1. Revenue, EBITDA, Net Profit & EPS Summary (₹ in Cr)
Particulars | FY26 | FY25 | YoY change |
Total Revenue | 4,202 | 3,569 | +17.7% |
EBITDA | 339 | 199 | +70% |
EBITDA Margin | 8% | 5.6% | +2.5 pp |
Net Profit | 125 | 10 | +1,104% |
NP Margin | 2.99% | 0.29% | +2.7 pp |
EPS | 18 | 1.58 | +1,053% |
Revenue grew a healthy 17.7%, but the real story is operating leverage - EBITDA grew nearly 4x faster than revenue (+70%), lifting margin by 2.5 pp. This flowed through to the bottom line, with net profit rising over 11x, aided by FY25's one-off fire-damage loss not repeating and finance costs holding flat despite a larger balance sheet.
2. Common-Size Statement (as % of Revenue, ₹ in Cr)
Particulars | FY25 (₹Cr) | FY25 (% revenue) | FY26 (₹Cr) | FY26 (%revenue) |
Total Revenue | 3,569 | 100% | 4,202 | 100% |
Cost of materials consumed | 3,054 | 85.5% | 3,487 | 82.9% |
Employee benefit expense | 48 | 1.37% | 53 | 1.26% |
Finance costs | 111 | 3.1% | 111 | 2.64% |
Depreciation & amortisation | 56 | 1.57% | 62 | 1.49% |
Material cost fell around 2.6 pp as a share of revenue, the single biggest driver of the EBITDA margin expansion. Finance cost also eased by 0.5 pp despite a larger balance sheet, while employee cost and depreciation remained broadly stable as a proportion of revenue.
3. Key Balance Sheet Items (₹ in Cr)
Particulars | FY26 | FY25 |
Property, plant and equipment | 633 | 569 |
Inventories | 899 | 797 |
Trade receivables | 664 | 437 |
Cash and cash equivalents | 25 | 11 |
Current borrowings | 674 | 680 |
Non-current borrowings | 336 | 282 |
Trade payables | 965 | 765 |
.
Trade receivables grew by 52%, far outpacing revenue growth (18%) - suggesting that though revenue and profits have expanded significantly in FY26 but the company faces difficulty in collecting cash. However, trade payables also grew 26%, indicating part of the receivables build-up was funded by stretching suppliers rather than drawing on working capital lines.
4.Key Ratio Analysis
Particulars | FY26 | FY25 | YoY change |
Net Profit Margin | 2.99% | 0.29% | +2.70 pp |
Return on Equity | 14.5% | 1.45% | +13.11 pp |
Fixed Asset Turnover Ratio | 6.6x | 6.2x | +0.36x |
Debt-to-Equity Ratio | 1.17x | 1.34x | -0.17x |
ROE's sharp jump is largely a low-base effect from a weak FY25. The Debt-to-Equity ratio actually improved (fell 0.17x) even as the balance sheet grew; the growth was funded more by retained earnings than fresh debt. Fixed asset turnover rose only modestly, consistent with FY26's profit growth being margin-led rather than driven by significantly better asset utilisation.
Date: Mon 27 Jul, 2026
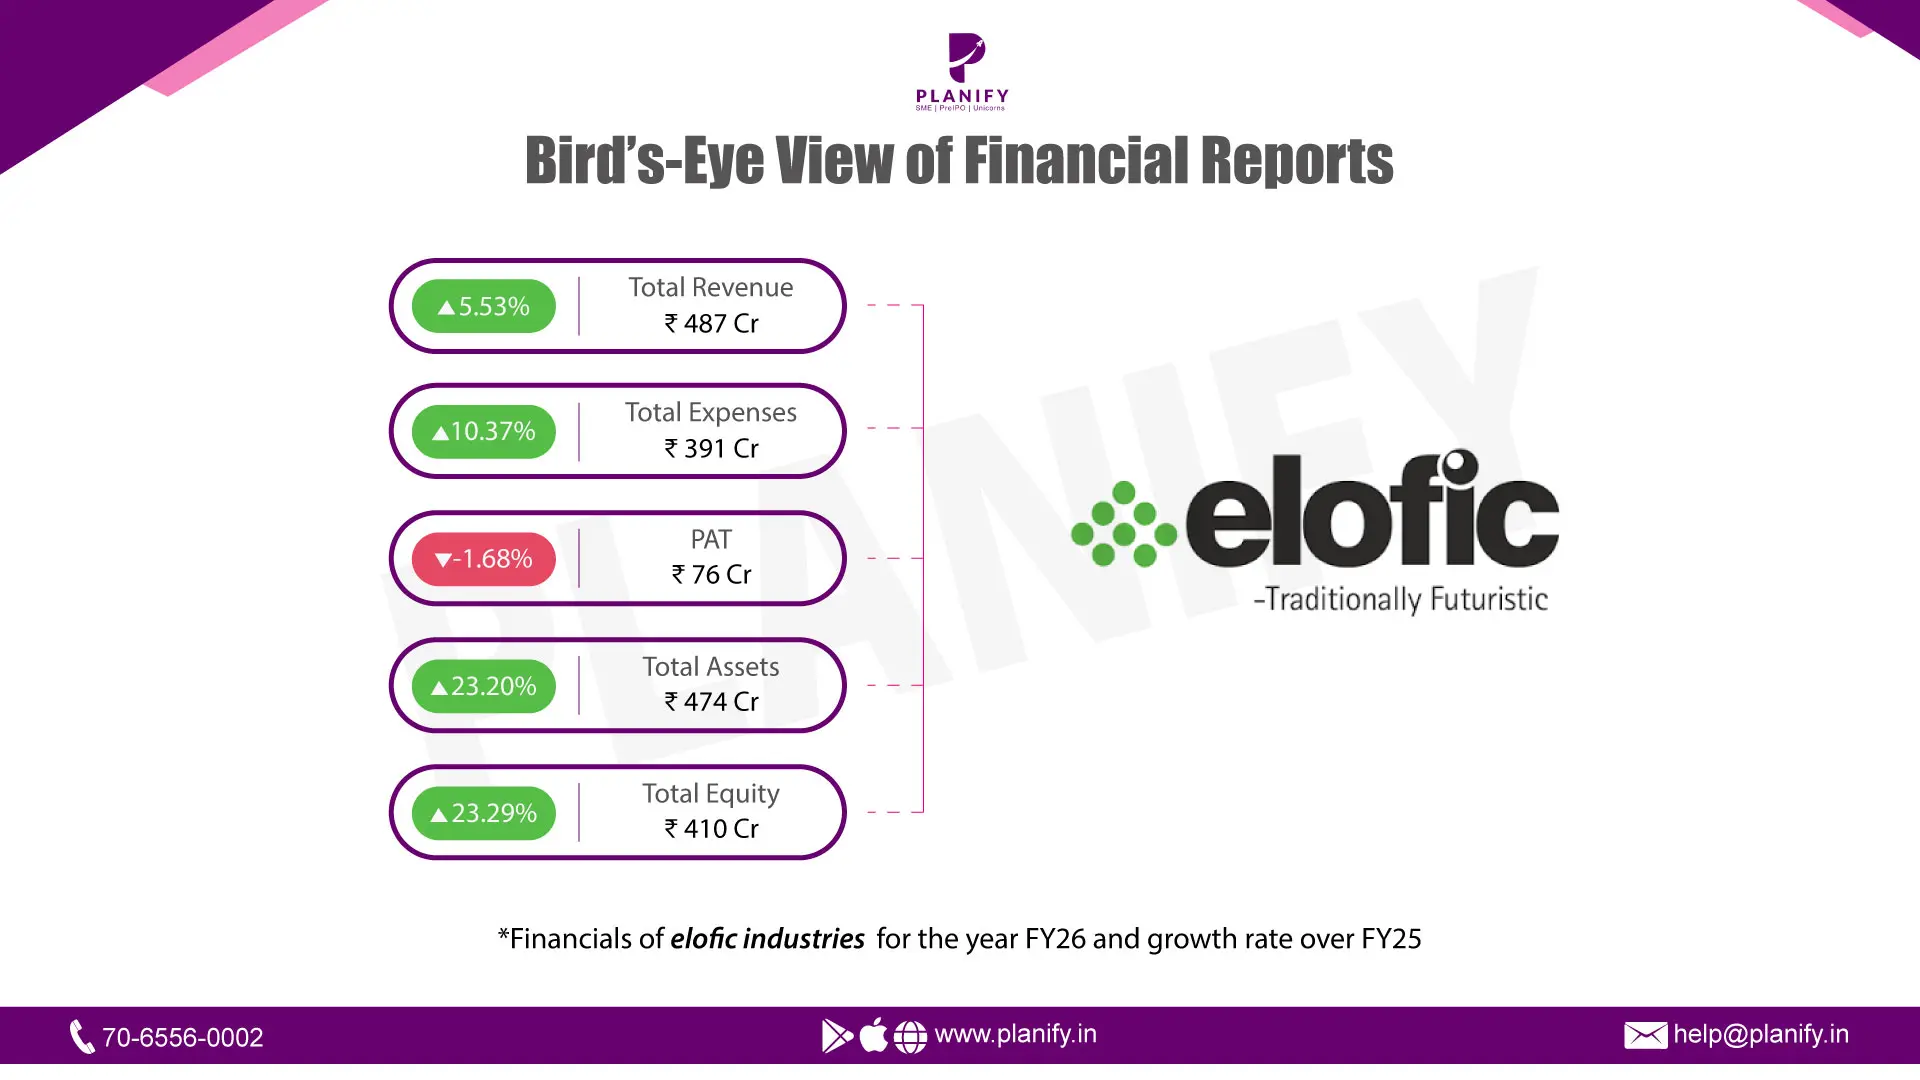
Financial Performance (FY26 Numbers & Projections):
Total revenues from operations for Elofic Industries Limited in FY26 were ₹459.6 crore, showing only a slight rise of 2.1% from ₹450.1 crore in FY25. Total income was ₹487.0 crore. This was aided by a sharp increase in Other Income, which went up to ₹27.4 crore, from ₹11.5 crore in FY25 due to treasury and forex gains. EBITDA decreased by 19.7% to ₹89.7 crore from ₹111.7 crore. This led to a margin decrease of 5.3 percentage points to 19.5% from 24.8%. This decrease in operating margins was due to an increase in cost of raw materials from 43.3% to 46.4% of revenues and an increase in employee benefits expense to 15.6% of revenues from 13.6%. PBT dropped by 10.4% to ₹96.5 crore, but PAT remained nearly flat at ₹76.0 crore, down by 1.6% from ₹77.3 crore in the previous year. PAT margin was thus 16.5%. Bottom-line performance benefited from non-operating treasury gains and the reduction in the effective tax rate to 21.2%, from 28.3% in FY25. Looking ahead, management has announced a public target for growth to ₹700 crore in annual sales by FY28.
Operational Metrics:
Elofic is a 75-year-old producer of filters that generates about 85 million filters annually via six production units situated in Faridabad, Nalagarh, and Hosur. The sales of Elofic Company are made via three different channels: OEMs, domestic aftermarket, and export sales. The share of exports is equal to 45% and involves supplying US OEMs with the help of domestic US warehouses. The company's domestic operations comprise a huge network of more than 1,400 distributors and 55,000 dealers. In terms of financial position, Elofic has increased its total assets by 23% to ₹473.6 crore in FY26, where the increase was made via equity financing only without any increase in long-term debt. The total debt of the company is equal to about ₹3.1 crore in lease liabilities, leading to Debt-to-Equity ratio of approximately 0.01x. Due to efficient working capital management and quick payments of customers, trade receivables have decreased from ₹84.8 crore to ₹68.3 crore, contributing to cash and equivalents of ₹62.1 crore, which is 16 times higher than ₹3.8 crore in FY25.
Key Project Executions & Order Book:
Elofic is engaged in large domestic as well as foreign OEM associations with various automakers and engine makers like Tata Motors, Royal Enfield, General Motors, Maruti Suzuki, Kohler, and Action Construction Equipment (ACE). There has been a 69% growth in operating cash flows in comparison to the previous fiscal year, amounting to ₹78.2 crore as compared to ₹46.3 crore in FY25. The management has used this cash flow for setting records of capex spending, where FY26 capex amount is ₹119.3 crore, almost seven times higher than ₹17.5 crore in FY25.
Strategic Developments & Outlook:
The technological differentiation and premiumization strategy of Elofic is a long-term one in order to overcome the issue of pricing competition in the aftermarket sector. Elofic has an exclusive R&D center accredited by DSIR that owns nine patents and eleven patents are under application. In order to overcome the issue of fluctuation in prices of raw materials and margins in the domestic market, Elofic is utilizing its growing international network. The present stage of capex cycle of Elofic makes it poised for the future filtration demand from automotive, tractor, industrial, and transport sectors.
Date: Mon 27 Jul, 2026
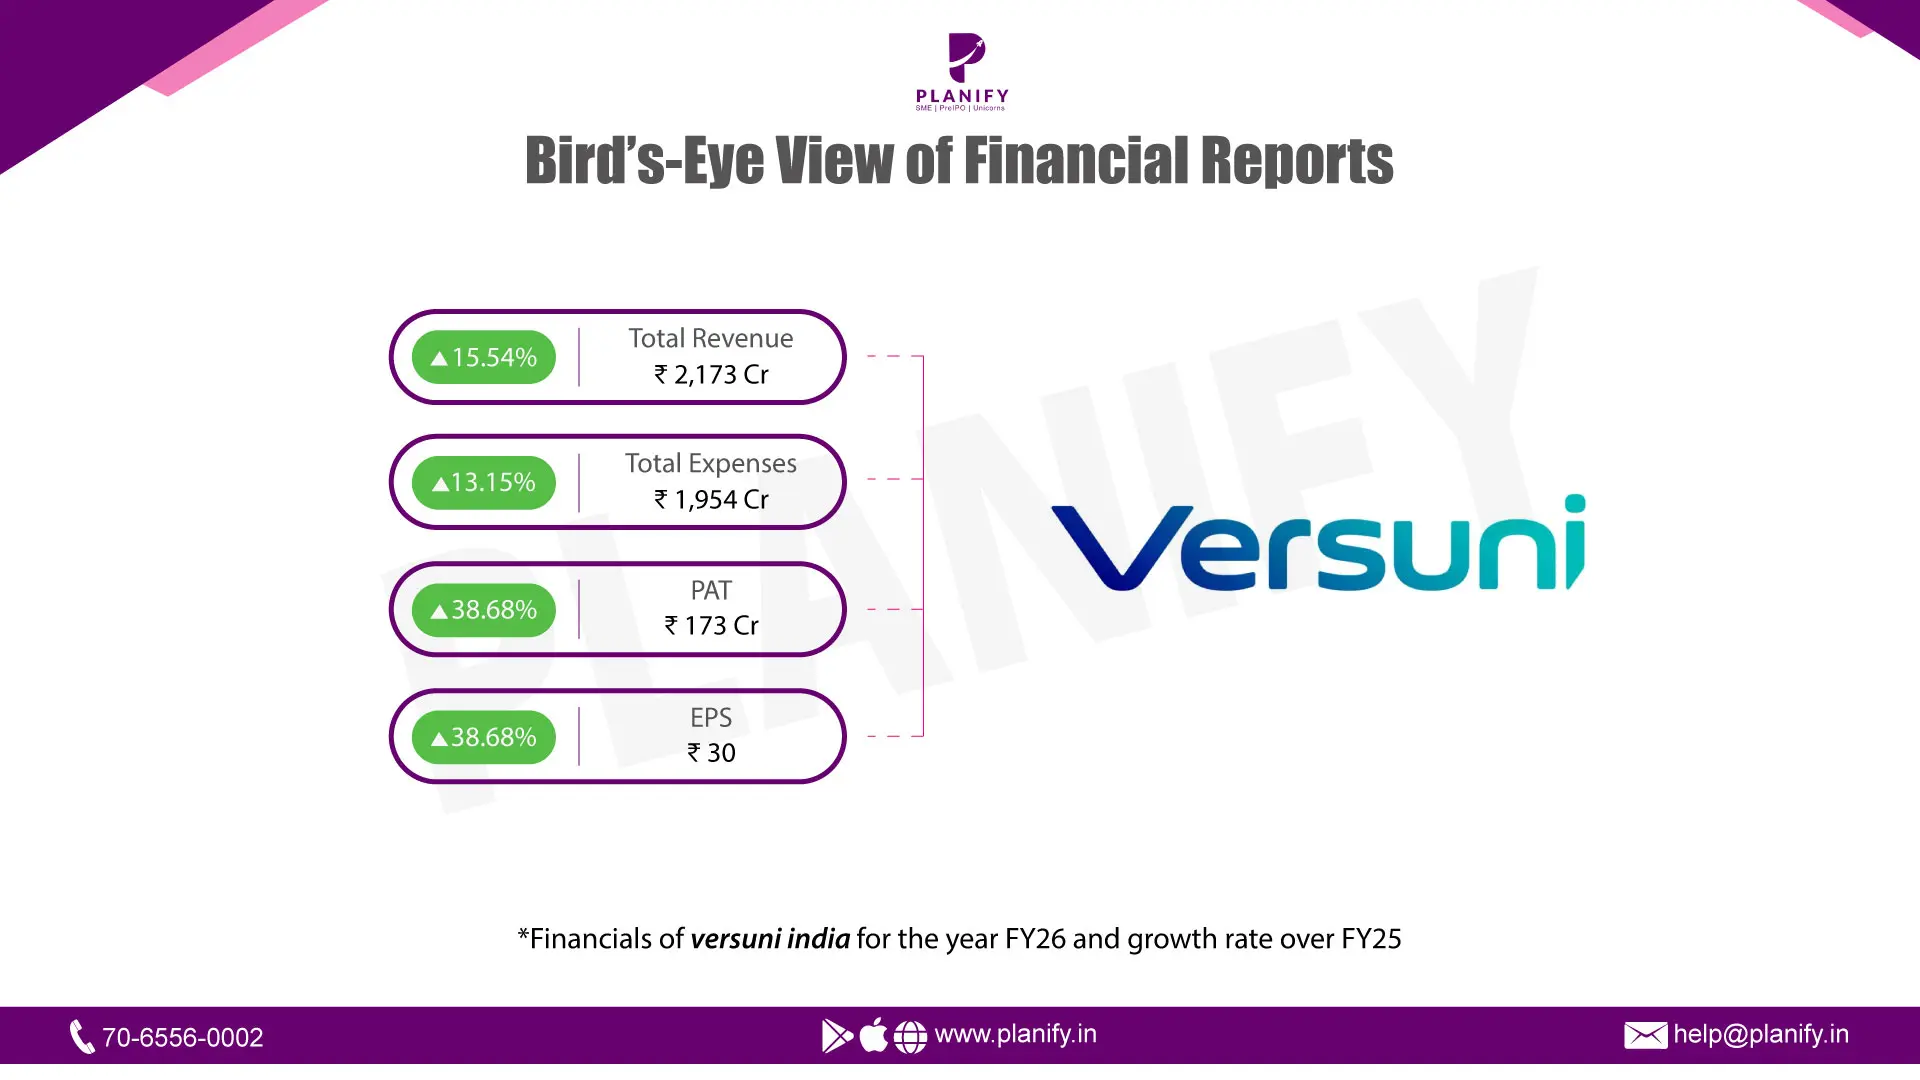
Versuni India: FY26 Financial & Operational Performance Analysis
Financial Performance (FY26 Numbers & Projections): Versuni India brought in revenue from operations of ₹2,173.11 crore in FY26, marking a solid 15.5% jump from ₹1,880.85 crore the previous year, with total income landing at ₹2,185.29 crore. EBITDA climbed 34.4% to ₹271.62 crore compared to ₹202.10 crore, pushing gross margins up to 43.5% from 40.3%. Profit Before Tax went up by 38.8% to ₹231.39 crore, while Profit After Tax followed closely with a 38.7% rise to reach ₹172.63 crore from ₹124.48 crore. That pushed the net profit margin to 7.90% and delivered an EPS of ₹30.01. A big chunk of this bottom line growth came down to a smart operational shift: cutting back on imported finished goods to build things locally at their Ahmedabad and Chennai facilities, alongside collecting cash from customers 20% faster. If you are looking at valuations with the share price sitting at ₹750, the stock trades at 25.0x reported FY26 earnings, or around 30.2x if you normalize those margins.
Operational Metrics: The business handles manufacturing and sales for small home appliances under the licensed Philips brand and their own Preethi brand, driven by a tight team of 1,353 employees. The public float is pretty tight at just 3.87%, leaving the Dutch parent company, Versuni Holding B.V., firmly in control with a 96.13% stake. Looking at the balance sheet, they are entirely debt-free and sitting comfortably on ₹410.43 crore in cash and deposits against a total equity base of ₹440.79 crore. Capital efficiency improved nicely as well, with Return on Equity moving from 36% to 43% and Return on Capital Employed ticking up from 39% to 44%. Reported operating cash flow shot up to ₹468.58 crore, though it is worth noting that more than half of that came from working capital adjustments, specifically a massive drop in traded goods inventory and stretched supplier payments.
Key Project Executions & Order Book: The big story on the ground this year was the deliberate pivot away from buying finished traded goods, which dropped 38.8%, in favor of ramping up raw material consumption by 93.2% to manufacture products locally across a combined 25,000 square metres of plant space. Product rollouts got a strong push across categories, highlighted by the Philips Airfryer seeing a 77% year-over-year surge, alongside the Preethi Zodiac and the newly launched OneChef appliance packing 33 functions. To keep their leadership secure in irons and air purifiers, they pushed ad spending up by 16.5% to ₹252.10 crore, which works out to 11.6% of revenue, while also rolling out a fresh ESOP scheme covering over 1.15 million options to keep key talent aligned.
Strategic Developments & Outlook: Moving forward, Versuni's playbook relies on capturing the remaining cost savings from local sourcing, with about 20% of their COGS import base still left to transition, giving them a realistic runway of another 200 to 300 bps in gross margin expansion. Even so, that eye-catching 38.7% profit spike is a one-time structural reset that is unlikely to repeat itself. On the flip side, you have to keep an eye on some genuine headwinds, including heavy related-party outflows of ₹164.23 crore heading back to the parent group via dividends, IT charges, and a 73% surge in Philips brand royalties. Toss in mounting E-waste liabilities, customer concentration where a single buyer accounts for 20% of revenue, and an upcoming Offer for Sale as the promoters look to offload a slice of that massive 96.1% holding, and you have got plenty to weigh against that valuation.
Date: Fri 24 Jul, 2026
Greenzo Energy India Limited (GEIL) is positioning itself as a key domestic supplier in India's green hydrogen sector by manufacturing equipment locally and providing complete engineering, procurement, and construction (EPC) solutions. To boost its production capacity, the company is setting up a new electrolyzer manufacturing facility in GIDC Sanand-II, Ahmedabad, with a capacity of 250 MW per year. This facility is designed under the Atmanirbhar Bharat initiative, and Greenzo's main products include local alkaline water electrolyzers with capacities between 150 kW and 5 MW, along with full Balance of Plant (BOP) systems. These solutions use up to 95% locally sourced components and proprietary Indian technology.
To support its growth, Greenzo has a strong project pipeline and order book exceeding ₹1,200 crore. This pipeline covers renewable energy and green hydrogen projects across India, Nepal, and Southeast Asia. Its active projects include notable commercial and industrial contracts, such as supplying a 1 MW alkaline electrolyzer to the Oswal Group, a 3 MW electrolyzer contract with Jindal Stainless Limited (JSL), a 30 Nm³/hr system for Felix Industries, and specialized units for Engineers India Limited (EIL). Designed to output high-pressure hydrogen directly at 30 bar, Greenzo's systems operate in a wide temperature range from -20°C to +60°C. These features help reduce capital costs by removing the need for external compression and allow for quick deployment in heavy industry decarbonization efforts.
Date: Fri 24 Jul, 2026
Ankur Jain, the founder and CEO of B9 Beverages, the parent company of craft beer brand Bira 91, has stepped down from the company's board and all executive roles, along with his family. His departure comes after a settlement deal with institutional investors and lenders. This agreement ends a lengthy two-year governance dispute involving nearly 30 stakeholders with conflicting financial interests. As part of the settlement, Jain and his family will give up their entire 17.8% equity stake in B9 Beverages and will no longer have operational control. In exchange, all active lawsuits and mutual claims will be withdrawn, and Jain is free from personal liabilities related to the corporate loans he had secured during the company's financial difficulties.
This resolution is a significant turning point for Bira 91, which has struggled for the past two years with serious cash flow problems, a mounting debt of about ₹1,000 crore, and a complete halt in manufacturing. In FY24, the company reported a net loss of ₹748.8 crore on operating revenues of ₹638.5 crore. This led to unpaid vendor debts, delayed employee salaries, and loan defaults. With the governance issue resolved and obstacles at the founder level cleared, major investors such as Japan's Kirin Holdings and Peak XV Partners, along with lenders like Anicut Capital and Hero Corporate Services, are starting a full balance sheet cleanup and recapitalization plan.
The new management team's top priority will be to secure fresh capital to pay off outstanding taxes, settle employee back-pay, address vendor debts, and restart brewery operations within the next 3 to 6 months. Reflecting on his departure, Jain thanked the stakeholders and recognized that although the brand faced difficult times, the agreement allows Bira 91 to enter a new growth phase with new leadership, better financial management, and a restructured balance sheet.
Date: Thu 23 Jul, 2026
The NIM story is actually the single most important thing happening at HDFC Securities right now, because it reveals the company is quietly turning into a lending business wrapped around a broking franchise. Here's the fuller picture with more precise standalone numbers (₹ crore, replacing the earlier rounded figures).
Headline P&L (Standalone)
Metric | Q1 FY26 | Q4 FY26 | Q1 FY27 | YoY |
|---|---|---|---|---|
Total Revenue | ₹729 cr | ₹850 cr | ₹950 cr | +30% |
Total Expenses | ₹425 cr | ₹497 cr | ₹558 cr | +31% |
Profit Before Tax | ₹304 cr | ₹353 cr | ₹392 cr | +29% |
Profit After Tax | ₹232 cr | ₹268 cr | ₹297 cr | +28% |
EPS (₹) | ₹130 | ₹150 | ₹166 | +28% |
Operating Margin | 42% | ~41% | 41% | -1pt |
Net Margin | 32% | ~32% | 31% | -1pt |
Consolidated PAT came in marginally lower at ₹296 cr, dragged by a ₹1 cr loss at the IFSC subsidiary on near-nil revenue.
Net Interest Margin
Metric | Q1 FY26 | Q1 FY27 | Change |
|---|---|---|---|
Interest Income | ₹303 cr | ₹451 cr | +49% |
Fees & Commission (broking) | ₹354 cr | ₹436 cr | +23% |
Net Interest Income (NII)* | ₹148 cr | ₹158 cr | +7% |
Average Loan Book | ₹6,446 cr | ₹8,607 cr | +33% |
NIM (NII / avg loan book, annualised) | 9.9% | 7.2% | -270 bps |
Finance Costs | ₹155 cr | ₹293 cr | +89% |
*NII = interest income less finance costs.
Two things jump out. First, interest income has overtaken brokerage fees as HDFC Securities' single largest revenue line for the first time — a structural shift, not a one-off. Second, despite interest income growing 49%, NII grew just 7%, because finance costs nearly doubled. The loan book (margin trading facility / client funding) itself expanded a sharp 41% in just one quarter — from ₹7,133 cr (31 Mar'26) to ₹10,081 cr (30 Jun'26) — funded increasingly through commercial paper (₹18,190 cr issued, ₹15,490 cr redeemed during the quarter) at rising rates (CP pricing moved from ~6.5% in April to ~8% by June). That's what's compressing NIM — the funding book is growing faster than the spread it earns.
Leverage & Balance Sheet KPIs
Metric | 31 Mar'26 | 30 Jun'26 |
|---|---|---|
Total Assets | ₹21,784 cr | ₹24,389 cr |
Loan Book | ₹7,133 cr | ₹10,081 cr |
Debt Securities | ₹12,931 cr | ₹15,600 cr |
Net Worth | ₹3,596 cr | ₹3,724 cr |
Debt-to-Equity | 4x | 5x (vs 3x a year ago) |
Interest Coverage | 3.1x | 2.4x |
Debt / Total Assets | 0.58 | 0.74 |
Not alarming for an NBFC-style book, but the leverage trajectory is steep enough to flag as a monitoring point — if CP rates keep climbing, finance costs eat further into NIM.
Peer Comparison — Q1 FY27 (₹ crore)
Company | Revenue | YoY | PAT | YoY | Op./EBDAT Margin |
|---|---|---|---|---|---|
HDFC Securities | 950 | +30% | 297 | +28% | 41% |
ICICI Securities (consol.) | 1,547 | +9.8% | 419 | +7.1% | 71.5% OPM |
Angel One (consol.) | 1,430 | +25.4% | 231 | +102%* | 32.7% EBDAT |
*Angel One's YoY jump flatters a weak base; sequentially PAT fell ~28% QoQ on IPL marketing spend. ICICI Securities' much higher operating margin reflects a more distribution/wealth-heavy, less lending-heavy mix — worth noting since HDFC Securities' growing loan book carries more balance-sheet risk than ICICI Sec's fee-led model.
Full KPI Checklist for This Business
Growth & scale: revenue growth, PAT growth, EPS growth, client base growth, branch/city footprint efficiency, digital transaction mix.
Margin quality (the new critical bucket): NIM on loan book, interest income vs fee income mix, NII growth vs interest income growth (spread compression signal), operating margin, net margin.
Balance sheet risk: loan book growth rate, debt-to-equity, interest coverage, debt/total assets, funding mix (CP vs debt securities vs equity).
Capital efficiency: RoE, book value per share growth, dividend payout (₹110/share interim paid this quarter, ₹197 cr total).
Peer positioning: revenue and margin versus ICICI Securities, Angel One, Motilal Oswal (yet to report Q1 FY27 as of writing).
Bottom line: the 28% PAT growth headline is real, but it's now being driven by balance-sheet expansion (margin lending) rather than broking volumes, and the NIM compression plus rising leverage are the numbers to watch into subsequent quarters — not red flags yet, but the trend line matters more than this quarter's print.
Date: Fri 17 Jul, 2026
Financial Performance (FY26 Numbers):
63SATS Cybertech generated about ₹87 crores in revenue from operations in FY26. This shows a significant 24 times increase from a small base of about ₹3.6 crores in FY25. The company is currently operating at a loss and has a negative book value because it spends a lot to develop its full-stack capabilities across various business lines. Looking ahead, the company aims for a full-year FY27 revenue target of ₹350 crores. In February 2026, a Series B funding round raised ₹245 crores from notable investors like Mathew Cyriac and Mukul Agarwal, leading to a post-money valuation of ₹1,161 crores.
Operational Metrics:
63SATS acts as a full-stack cybersecurity company organized into three separate business segments that serve different consumer groups. The company focuses on three main offerings: CSF (Cyber Security Force), which provides threat detection and anti-Pegasus mobile defense for businesses; Cyberdome, which offers military-grade protection for government and critical infrastructure; and CYBX, a consumer security super-app. On the consumer front, the CYBX app has surpassed 2 million downloads and converted over 3.25 lakh users into paying subscribers. Growth benefits from regulatory changes like India's DPDP Act, prompting the company to provide specialized compliance-as-a-service offerings.
Key Project Executions & Order Book:
By the first quarter of FY27, the company reported a clear committed order book of around ₹288 crores, covering about 82% of its full-year FY27 revenue target. Of that total, ₹100 crores has already been billed. The company's list of enterprise clients includes high-profile corporations and defense entities in India, such as the Indian Navy, ICICI Securities, Adani Ports, Bharat Forge, Raymond, Marico, Lupin, and others across banking, defense, and manufacturing.
Strategic Developments & Outlook:
63SATS is taking advantage of strong trends like India's data localization rules, the DPDP Act, and a growing preference for "India-first" sovereign security infrastructure. Under the leadership of Chairman Lt Gen M. U. Nair (Retd.), who is India's former National Cyber Security Coordinator, the company is well-positioned to secure sensitive government and critical defense contracts. The future plan emphasizes high-margin, scalable intellectual property products, particularly their AI-powered security operations tool and dedicated "cybersecurity for AI" frameworks to boost profitability as they move beyond their current investment phase.
Date: Mon 13 Jul, 2026
Financial Performance (FY26 Numbers & Projections):
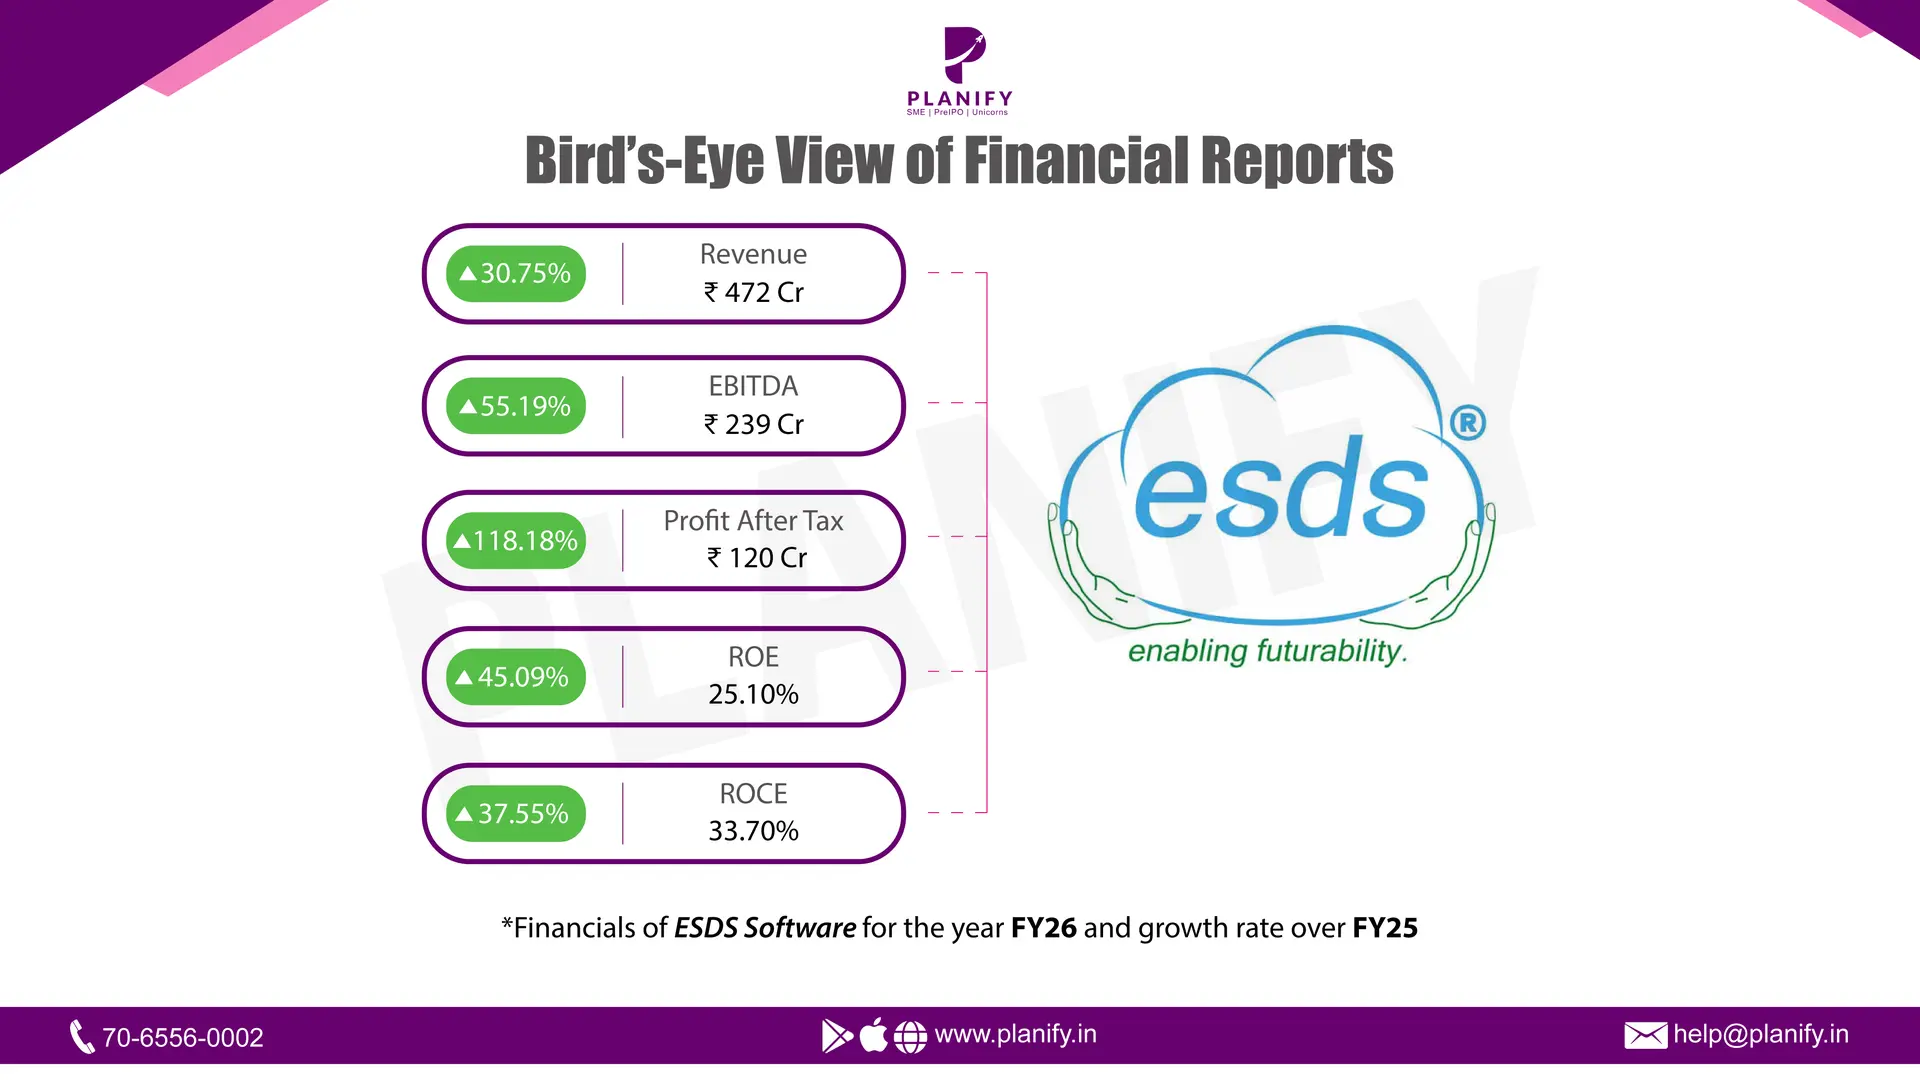
ESDS Software Solution Limited generated total revenue of ₹472 cr from operations in FY26. This shows a compound annual growth rate (CAGR) of 28.4% from ₹286 crores in FY24. EBITDA jumped to ₹239 crores in FY26, reflecting a CAGR of 53.5%, and the EBITDA margin increased to 50.8%. Profit After Tax (PAT) rose dramatically at a CAGR of 197.9%, reaching ₹120 crores in FY26, which resulted in a PAT margin of 25.6%. This increase in margin was due to careful management of staff, productivity improvements driven by AI, and a focus on higher-margin accounts. Looking ahead, a significant global deal with Sharon AI, valued at about $1.95 billion over five years, provides substantial visibility. Upcoming revenue is expected to reach ₹1,927 crores in FY27 and exceed ₹3,800 crores annually from FY28 through FY31, while maintaining Gross Margins of 37%.
Operational Metrics:
ESDS operates an integrated full-stack cloud, managed services, and software platform. As of March 31, 2026, the company expanded its network to five operational data centers serving 2,516 customers in total. The Net Revenue Retention (NRR) rate is strong at about 95.46%. Revenue from existing clients makes up 73.0%, while new customers account for 27.0%. By sector, revenue comes primarily from Enterprises (55.1%), followed by Government (27.4%) and Banking, Financial Services, and Insurance (BFSI) (17.5%). The service mix includes Managed Services (41.2%), Infrastructure as a Service (IaaS) (43.9%), and Software as a Service (SaaS) (14.9%). ESDS has a secure balance sheet, with a debt-to-equity ratio of -2.13x and ₹1250 crores in cash available for its ongoing AI development. The company currently has a domestic capacity of approximately 8.9 MW across Nashik, Mumbai, Bengaluru, Noida, and Mohali.
Key Project Executions & Order Book:
The company has a strong domestic order book of ₹980 crores, with 70% set to be monetized within the next three years. The near-term conversion pipeline includes ₹339 crores for FY27, ₹215 crores for FY28, and ₹140 crores for FY29. Notable institutional clients using ESDS platforms include Canara Robeco Mutual Fund, the Indian Institute of Banking & Finance (IIBF), Indian Oil Skytanking, Balmer Lawrie & Co. Ltd., and Kolhapur District Central Co-operative Bank. On the AI infrastructure side, the company generated ₹75 crores in technical design and GPUaaS revenue in FY26. To mitigate risks, ESDS received ₹1,187 crores in upfront customer advances to fully fund the infrastructure build.
Strategic Developments & Outlook:
ESDS acted quickly to benefit from India’s data localization rules, the DPDP Act 2023, and MeitY/STQC cloud empanelment standards. The company runs two distinct operations under its sovereign cloud platform: community clouds for regulated sectors (Engine 1) and high-growth, dedicated AI infrastructure SPVs (Engine 2). The outlook includes 8,192 contracted NVIDIA B300 GPUs expected to go live in October 2026, plus an additional 16,000 GPUs in advanced discussions, bringing total committed capacity to about 24,000 GPUs. To support this scale, ESDS plans to expand its liquid-cooled domestic data center capacity to around 37.8 MW by FY30, featuring a new 20 MW site in Sahibabad. Globally, the company has grown its presence to 60 MW of offshore IT load capacity across Australia and the Nordics, with 20 MW already operating in Australia.
Date: Fri 10 Jul, 2026
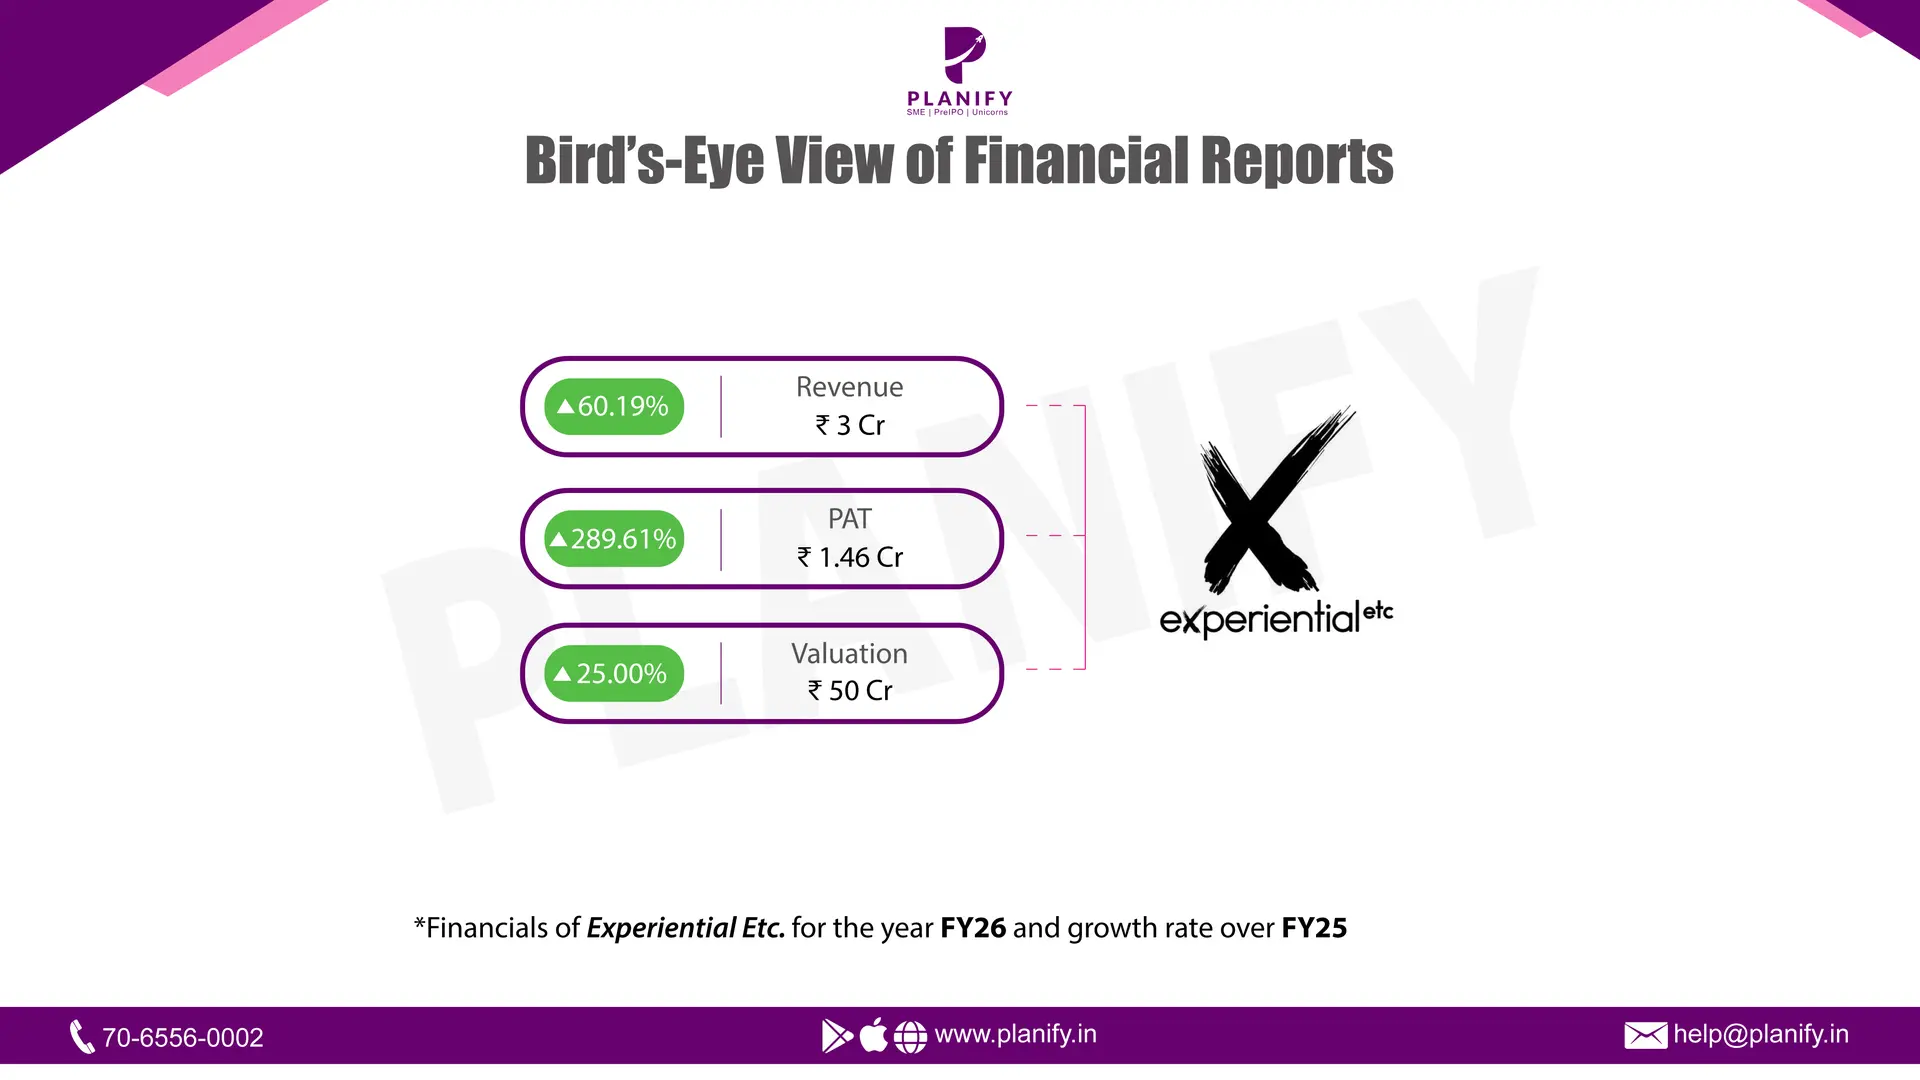
Financial Performance (FY26 Numbers & Projections):
The total revenue for ExperientialEtc reached ₹3.3 crore in Financial Year 2026. Immersive tech makes up most of this revenue. Eighty percent comes from content (Anamorphic/3D), and the remaining twenty percent is from software and tech solutions. The company showed strong profitability, with a net profit of ₹1.46 crore and a net profit margin of 44.2%, leading in the industry. Looking ahead, management set ambitious revenue growth targets, projecting ₹7.5 crores for FY27, ₹16 crores for FY28, and ₹25 crores for FY29. Following this trend, the company’s valuation rose to ₹50 crore in 2026, up from ₹3.5 crore in 2021 and 2022. This increase was supported by institutional and HNI investors, including StartupLanes, Snard, We Founder Circle, India Accelerator, IVY Growth, and Planify Capital. To strengthen its global market leadership, the firm is seeking to raise ₹1.5 crores.
Operational Metrics:
ExperientialEtc maintains a very lean cost structure with fixed expenses limited to just ₹8 lakhs per month. This setup gives the business great operational scalability. The main operational model works on a "Produce in India, Sell Globally" system, keeping production costs low while allowing for high margins. Operations are efficient due to proprietary mathematical templates designed for various screen curvatures (L-shape, U-shape, Curved), which ensure reliable scaling of forced-perspective visual illusions without manual calibration errors. Instead of paid marketing, the brand relies on strong organic search results, ranking No. 1 on Google in India and appearing on the first page globally for key phrases like "Top Anamorphic Agency" and "Top 3D Billboard Agency." Globally, its organic search presence ranks in the Top 2 to 5 in the Middle East, Top 5 to 10 in Europe, Top 3 to 10 in Asia-Pacific, and Top 3 to 7 in Africa. The current investment ask allocates 40% of funds to global sales and business development, 30% to talent and technology infrastructure (GPUs and senior VFX leads), 20% to marketing and SEO defense, and 10% to scaling operations.
Key Project Executions & Order Book:
The company has a strong delivery record, successfully completing over 750 campaigns across more than 75 technologies for over 250 brands, generating over 500 million total impressions. It has delivered impressive "stop-and-stare" anamorphic visual assets for leading enterprises around the world. The company’s ongoing projects include strong international client partnerships and retainer agreements. One notable timeline features a 6-month partnership with Magnate Ventures in Kenya to distribute localized anamorphic content across several African screen networks.
Strategic Developments & Outlook:
Originally founded as a 360° tech-activation agency between 2017 and 2022, specializing in holograms, AR/VR, and projection mapping, ExperientialEtc successfully pivoted in 2023 to focus solely on premium CGI and Anamorphic 3D content engines. The brand gained national credibility and recognition after appearing in Season 1 of Shark Tank India. To drive global expansion, the firm secured key international partnerships, working with HIT Ltd in Japan for access to premium media networks, teaming up with Adintime in Hong Kong to tap into APAC markets, and forming a joint venture called "Crea8Xp" in the US and Philippines to enable global scalability of content. As the agency moves into a later phase of commercial expansion, it is focusing on high-margin, physics-heavy simulations (hyper-realistic fire, water, and fluid dynamics) for major international screens. These projects command contract sizes ranging from ₹10L to ₹35L or more per deployment. This strategy positions the agency well to capture a global 3D display market projected to reach a total addressable market of $510.91 billion by 2030.
Date: Thu 02 Jul, 2026
Power Exchange India Limited (PXIL), India's second operational power electronic marketplace regulated by the CERC, is gaining significant attention in the unlisted market with an implied valuation of about ₹3,100 crore. Promoted by major players like NSE Investments, NCDEX, and Power Finance Corporation, the company runs a digital transaction platform where electricity and energy certificates are traded. This marketplace helps distribution companies (DISCOMs), large industrial units, independent power producers, and open-access consumers manage risk, improve short-term energy procurement, and achieve price discovery transparently and in real time.
PXIL’s operations center around a business model that relies on volume-based transaction fees. Unlike stock exchanges that charge based on trade value, PXIL imposes a flat transaction fee linked strictly to physical volume. This fee is typically set at ₹0.02 per kWh from both buyers and sellers for electricity and a fee of ₹10 per unit for Renewable Energy Certificates (RECs) and Energy Saving Certificates (ESCerts). PXIL diversifies its core transactional income with recurring revenue from new member registrations, annual subscription fees, software connectivity charges, and interest income from cash reserves. The exchange serves as a central counterparty that collects upfront margins and guarantees settlement, which eliminates counterparty credit risk. This structure provides significant operating leverage; once its digital platform infrastructure is established, incoming trading volumes contribute directly to profits with minimal additional costs.
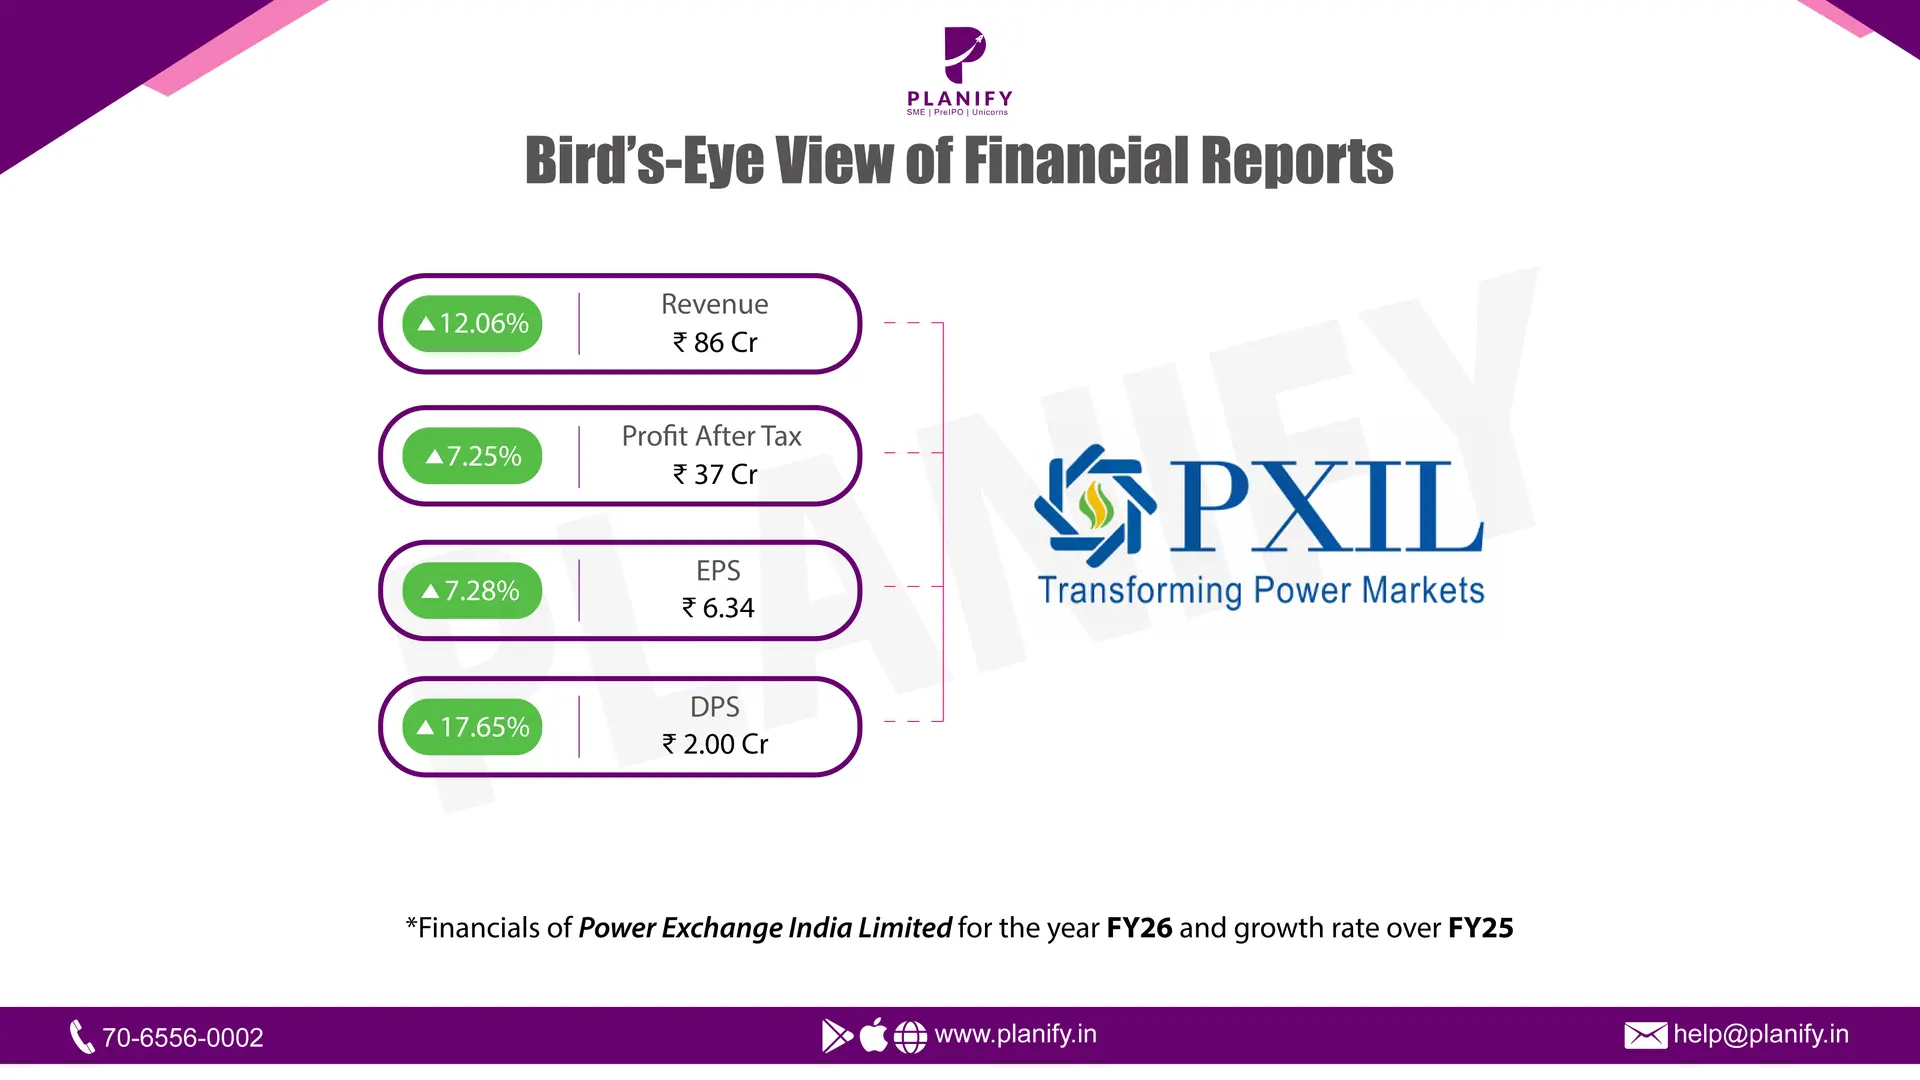
Financially, the company has had a steady, albeit modest, year. Revenue from operations grew by a solid 12.1%, reaching ₹86.4 Cr in FY26 compared to ₹77.1 Cr in FY25. However, total income growth was a bit softer at 8.1%, climbing to ₹100.4 Cr in FY26 from ₹92.9 Cr in FY25. This slowdown was due to a decline in interest income from the company’s large cash reserves, while other income fell by 11.4% to ₹14.1 Cr. On the expense side, rising employee costs and taxes limited overall earnings growth, keeping total expenses at ₹50.7 Cr. As a result, Profit After Tax (PAT) showed a modest rise of 7.2%, reaching ₹37.0 Cr in FY26, up from ₹34.5 Cr in the previous fiscal year. This increase pushed its Earnings Per Share (EPS) up by 7.3% to ₹6.34, allowing the company to raise its dividend per share from ₹1.70 to ₹2.00.
The primary investment opportunity enhancing this price tag is the upcoming implementation of market coupling under India's power sector reforms. This regulatory change aims to centralize price discovery into a single national pool across all platforms, effectively breaking down the near-monopoly of Indian Energy Exchange (IEX). While the ₹3,100 crore valuation suggests a high multiple compared to its current trailing earnings (trading at a P/E of roughly 80x to 90x based on the FY26 EPS of ₹6.34), its backing by institutions, debt-free balance sheet, strong cash reserves, and the significant structural tailwinds of growing power demand in India make it an attractive high-growth option for long-term pre-IPO investors willing to navigate the regulatory changes.
Date: Wed 01 Jul, 2026
Renfra Energy Limited (CIN: U74999TN2017PTC119232) is a 2017-founded unlisted company incorporated in Chennai, Tamil Nadu. The company has successfully filed its Draft Red Herring Prospectus (DRHP). Renfra brands itself as a clean energy powerhouse with core competencies in Solar PV EPC, Wind Energy Solutions, Operation and Maintenance (O&M) and Commercial and Industrial (C&I) segments. The Public Issue comprises a Fresh Issue of up to ₹430.00 Crores and an Offer for Sale (OFS) of up to 47,94,800 Equity Shares, which is proposed to be listed on both the National Stock Exchange of India (NSE) and BSE Limited.
On the financial side ReNfra EnerGy has delivered an explosive profitability unlock with its move to a high-margin Material+Labour contract model that managed to grow its margins from 3% to 13%. The company recorded a strong growth of 104% Year-on-Year with total revenues of ₹1,040 Crores in FY26. Its Profit After Tax (PAT) has been on a steady upward trajectory over the last four fiscal years, growing from ₹28 Crores in FY23 to ₹45 Crores in FY24, ₹94 Crores in FY25 and over ₹150 Crores in FY26, which is a 60% YoY growth in the latest fiscal year. In addition, the company has a very decent and strong balance sheet with a low gearing ratio of below 0.5x.
The company's mid to long term earnings visibility is well supported by a strong and active order book of over ₹900 Crores. This execution pipeline is further bolstered with a major ₹3,050 Crore Memorandum of Understanding (MOU) inked with the Government of Tamil Nadu. ReNfra EnerGy is a next-growth catalyst with plans to aggressively scale up its execution capacity from 300 MW to 13 GW by FY27. The growth will be propelled by a strategic push into the neighboring states of Karnataka and Andhra Pradesh, which is anticipated to generate a revenue CAGR of 73% over the next four years.
Date: Wed 01 Jul, 2026
Financial Performance (FY26 Provisional numbers vs FY25):
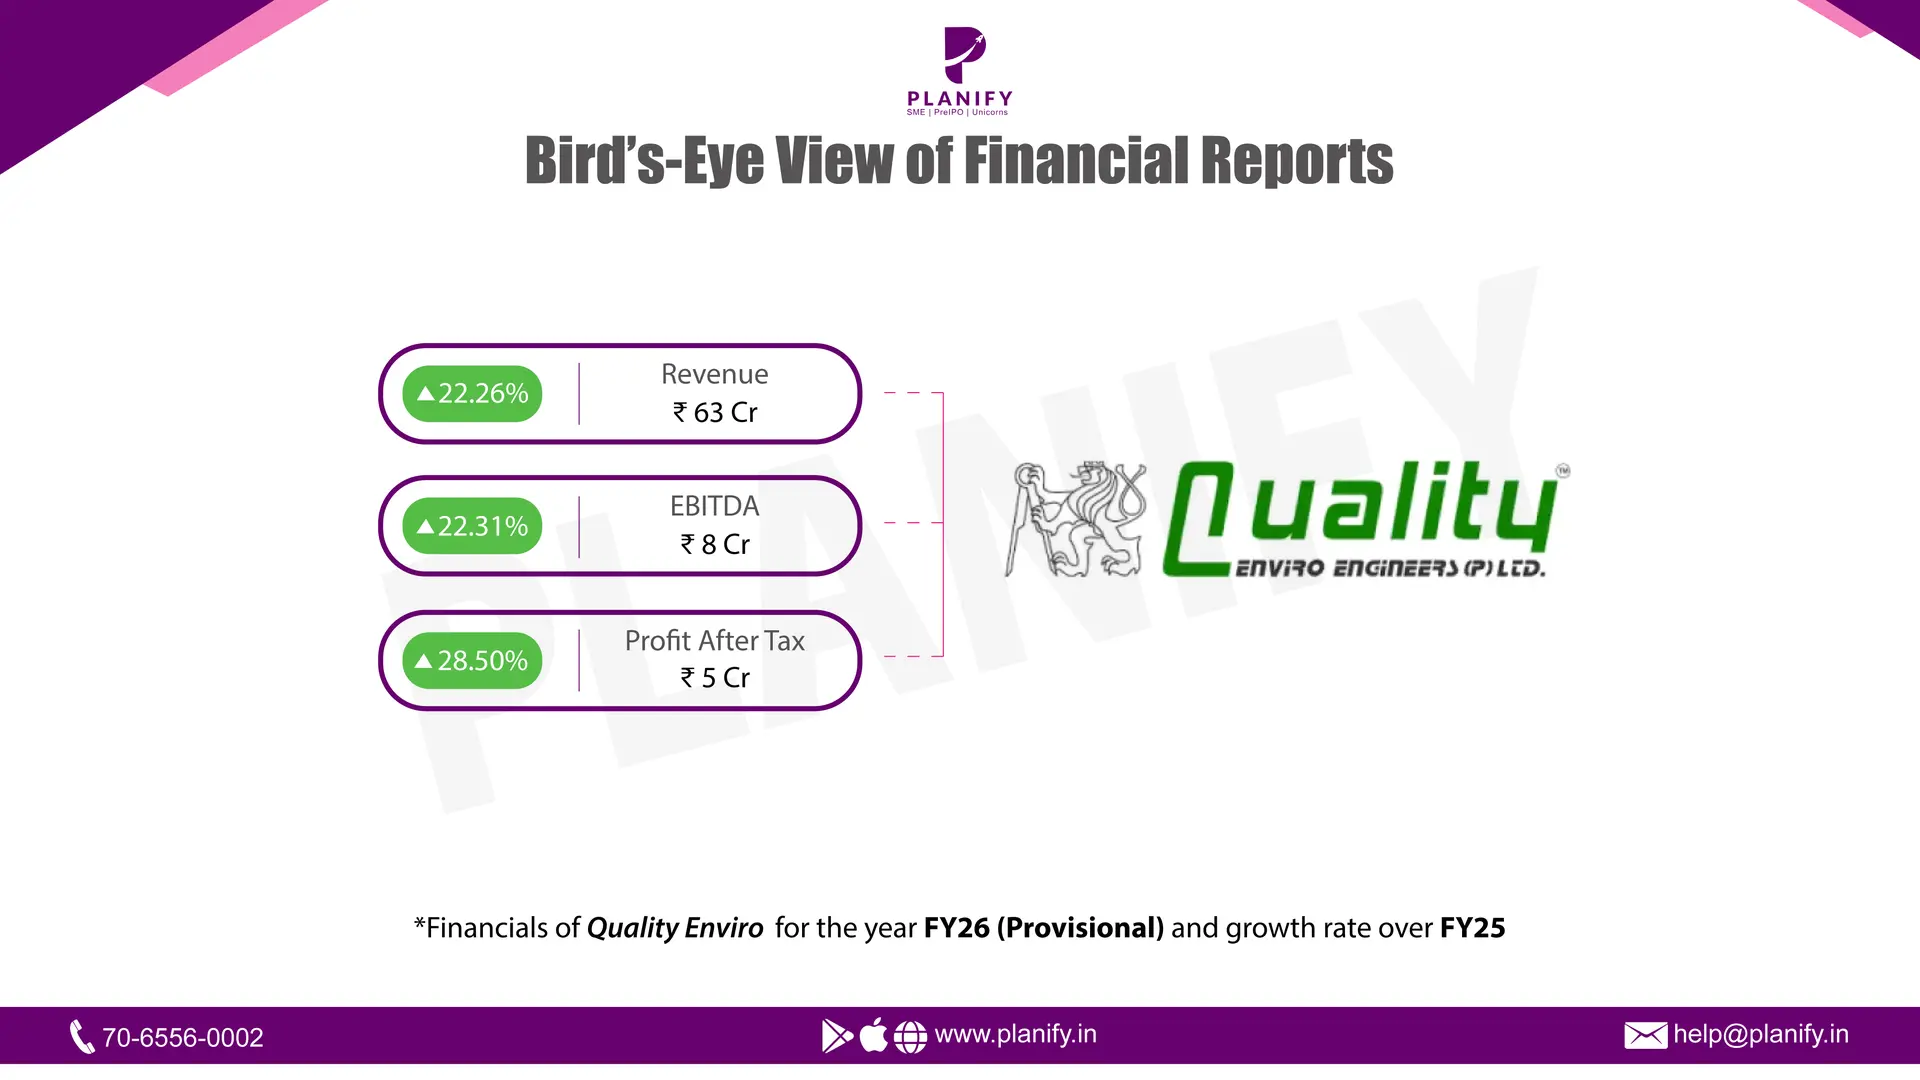
The total revenue of Quality Enviro Engineers Limited has been increasing consistently in FY26, with an increase of total revenue by 22.3%, with its value being ₹62.99 crore as compared to ₹51.52 crore in FY25. This was mainly due to efficient project execution along with expanding markets. EBITDA has also been increasing to ₹7.84 crore in FY26 from ₹6.41 crore in FY25, while the EBITDA margin has remained constant at 12.45%. Similarly, PAT has increased significantly from ₹3.93 crore in FY25 to ₹5.05 crore in FY26. The growth rate for revenue, EBITDA, and PAT has been consistent for the past two financial years, which is 22.3%, 22.3%, and 28.5%, respectively.
Operational Metrics (FY26 Provisional numbers vs FY25)
During FY26, Quality Enviro Engineers Limited increased its unit production to 204 from the previous fiscal year, thereby increasing the manufacturing capacity of the company by 8.5% on a year-over-year basis. The manufacturing capacity of the company stands at 320 units, implying a spare manufacturing capacity of 116 units. The company has scaled its operation on a significant note by increasing its employee strength by 86%, wherein it increased its employee strength to 156 from 84 in the FY26 fiscal year. It has been able to manage its liabilities and assets for its operational growth, whereby the total borrowings are approximately ₹20 crore against the fixed deposits of ₹13 crore. To fund further scaling, a banking limit enhancement of +₹10 crore is currently planned and in process.
Key Project Executions & Order Book (FY26 Provisional numbers)
Execution of projects as well as pipeline was strong during FY26 with the order book being at more than ₹14 crore and the bidding pipeline close to ₹40 crores. The main projects delivered during FY26 include delivery of 7 road sweeping machines worth ₹11.00 crore for Dhanbad Municipal Corporation and delivery of solar panel batteries & equipment worth ₹7.00 crore to RCRS Innovations Ltd that marks our strategic entry into the renewables space. Other important executions include fog cannon and desilting machine worth ₹5.70 crore in Uttar Pradesh, installation and commissioning worth ₹5.30 crore for TPS Infra, anti-smog gun, jetting machine & sprinklers worth ₹4.90 crore in Delhi. The ongoing projects in the order book include Delhi MCD (12 anti-smog guns worth ₹7.20 crore), Chandigarh (5 anti-smog guns worth ₹2.10 crore), and Belagavi (10 hopper tippers worth ₹1.30 crore).
Strategic Developments & Outlook
Quality Enviro Engineers Ltd. has remained a leading engineering firm specializing in infrastructural and sanitation related projects. The geographical presence of the firm has expanded to include Delhi, Chandigarh, Haryana, Uttar Pradesh, Manipur, and Vishakhapatnam. In addition to growing its main areas of specialization, which include anti-smog guns, sanitation equipment, jetting machines, and sprinklers, the firm has ventured into making new products including fire rescue vehicles and hopper tippers. Looking forward, the management has set revenue growth guidance of 40-50% year on year (YoY) for FY27 due to a stronger order pipeline and efficient fixed costs absorption. This comes from the commissioning of a new plant by the company.
Showing 1-10 of 1774 results
Stay Connected, Stay Informed –
Don’t miss out on exclusive updates, market trends, and real-time investment opportunities. Be the first to know about the latest unlisted stocks, IPO announcements, and curated Fact Sheets, delivered straight to your WhatsApp.