Planify Feed

Date: Thu 14 Aug, 2025
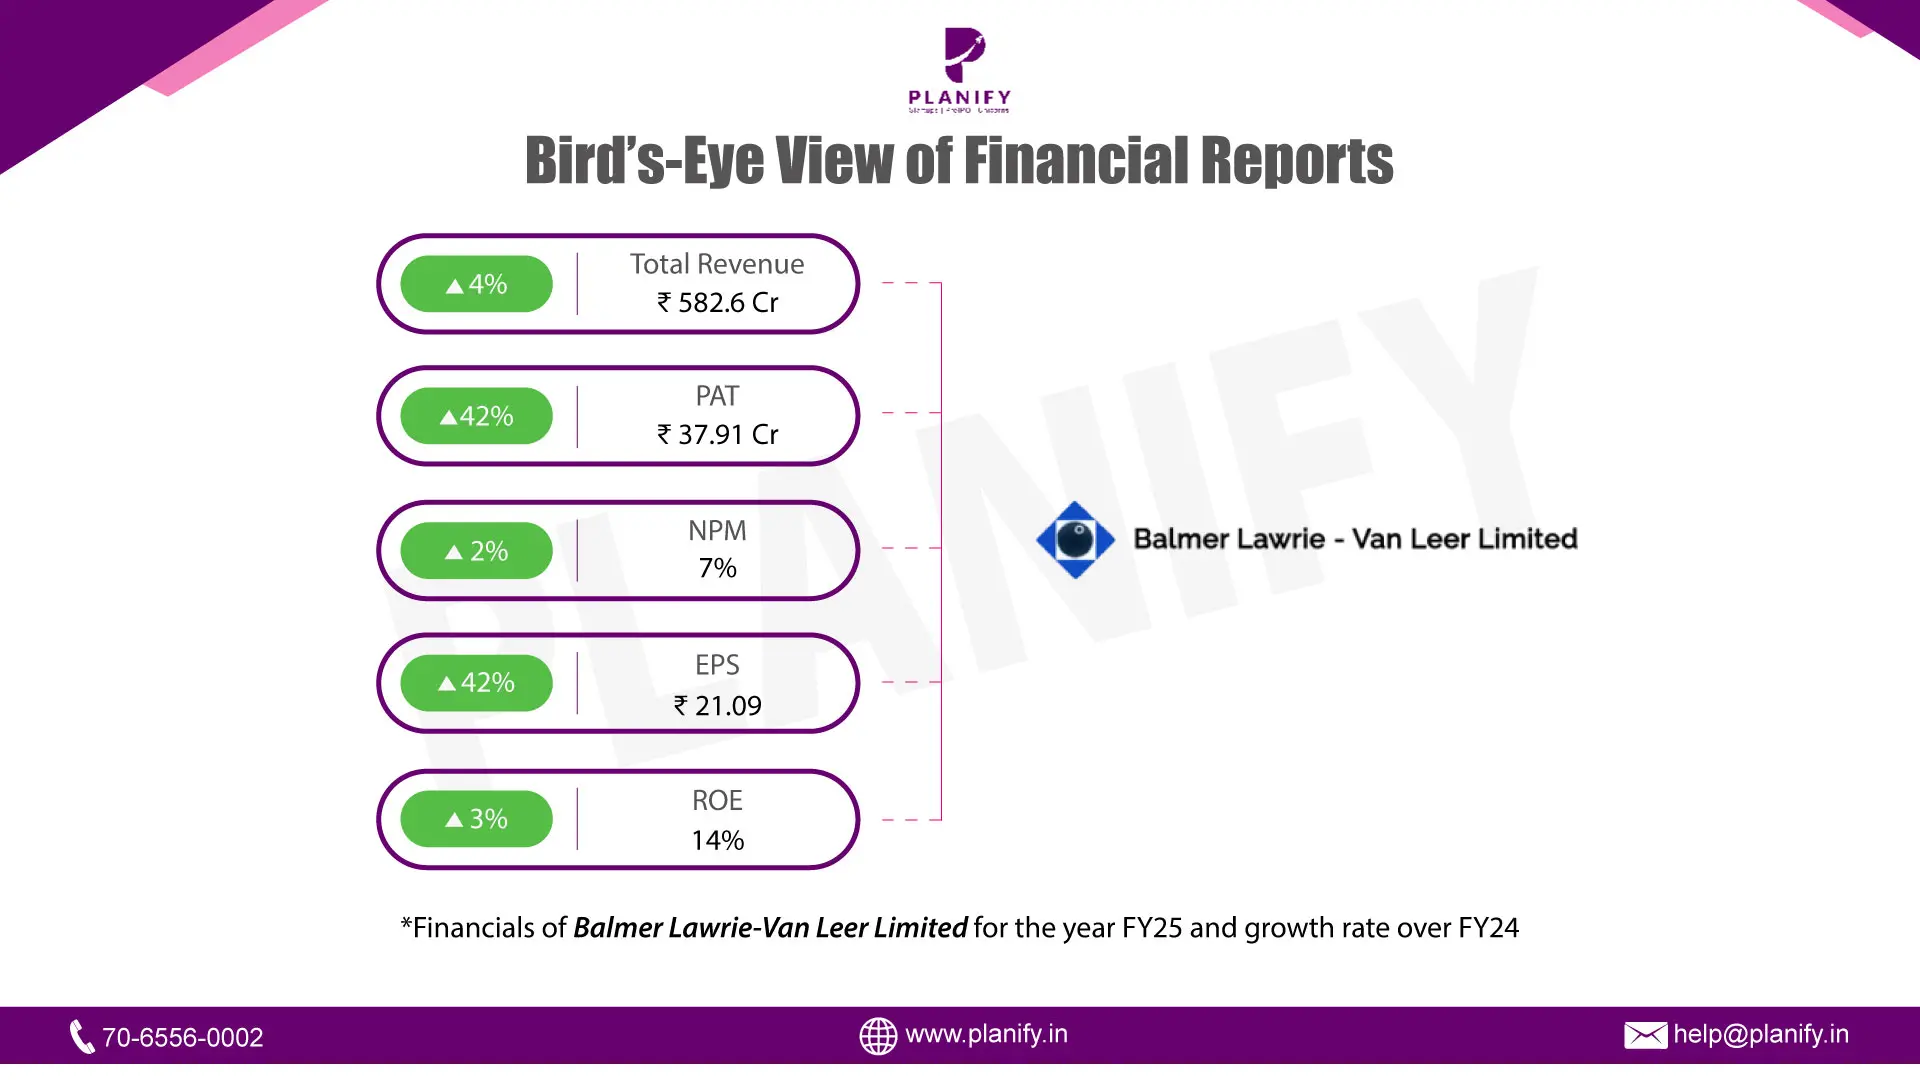
Balmer Lawrie-Van Leer Limited achieved impressive financial performance for the fiscal year ended March 31, 2025, with Revenue from Operations increasing to INR 58,259 Lacs (from INR 56,049 Lacs in the previous year), Profit Before Tax (PBT) rising to INR 5,005 Lacs (from INR 3,693 Lacs), and Net Profit After Tax (PAT) increasing to INR 3,791 Lacs (from INR 2,666 Lacs). This significant growth was driven by a combination of strategic foresight and operational excellence:
Strategic Drivers
- Market Resilience and Customer Focus: The Company demonstrated resilience and meaningful progress despite a challenging operating environment marked by geopolitical uncertainties, inflation, and rising energy prices. This was achieved by leveraging long-term customer relationships and consistently delivering value.
- Strategic Diversification: Balmer Lawrie-Van Leer actively pursued new opportunities and high-growth segments.
- In Packaging, we expanded our presence in Food, Spices, Inks, Oil, Lubricant, and Agro Chemicals.
- The Steel Division diversified into the design and manufacture of customized Auto Components and white goods components, also expanding its geographical reach and securing orders from prominent customers.
- Regulatory Adaptation & Product Innovation: We proactively adopted global best practices as a packaging solution provider to address stringent regulations like plastic waste management laws for a circular economy and food safety norms for food packaging. New products are also being introduced based on deep consumer research.
- Leadership Transition: The Company welcomed Mr. Sanjay Datta as Managing Director from January 12, 2025, bringing extensive experience to build upon the sustained growth.
Operational Excellence & Investments
- Manufacturing Restructuring & Capacity Enhancement: The Company has been actively restructuring its manufacturing facilities and investing to diversify and increase production capacity across all units.
- Food-compliant manufacturing facilities at Pune and Dehradun are now fully operational, catering to the growing food and beverage sectors. Additional capital expenditure is planned for the Chennai division to enhance production capability.
- A dedicated manufacturing facility is under development at Bengaluru to enhance efficiency in manufacturing and assembling automotive components.
- Efficiency and Cost Optimization: Continuous efforts were made to improve production capabilities and keep operational costs under control, leading to better sales realization across plastic divisions. There was a strong focus on enhanced capacity utilization and optimization of costs.
- Technological Infusion & Energy Conservation: We are constantly upgrading in-house technology with technical input from our JV partner, Greif, to improve operational efficiency. Significant energy conservation measures were implemented, including sourcing renewable energy and installing energy-saving equipment.
- Product Mix Improvement: The Company is focused on improving its product mix and moving up the value chain to maintain its position in the premium price segment.
Date: Thu 14 Aug, 2025
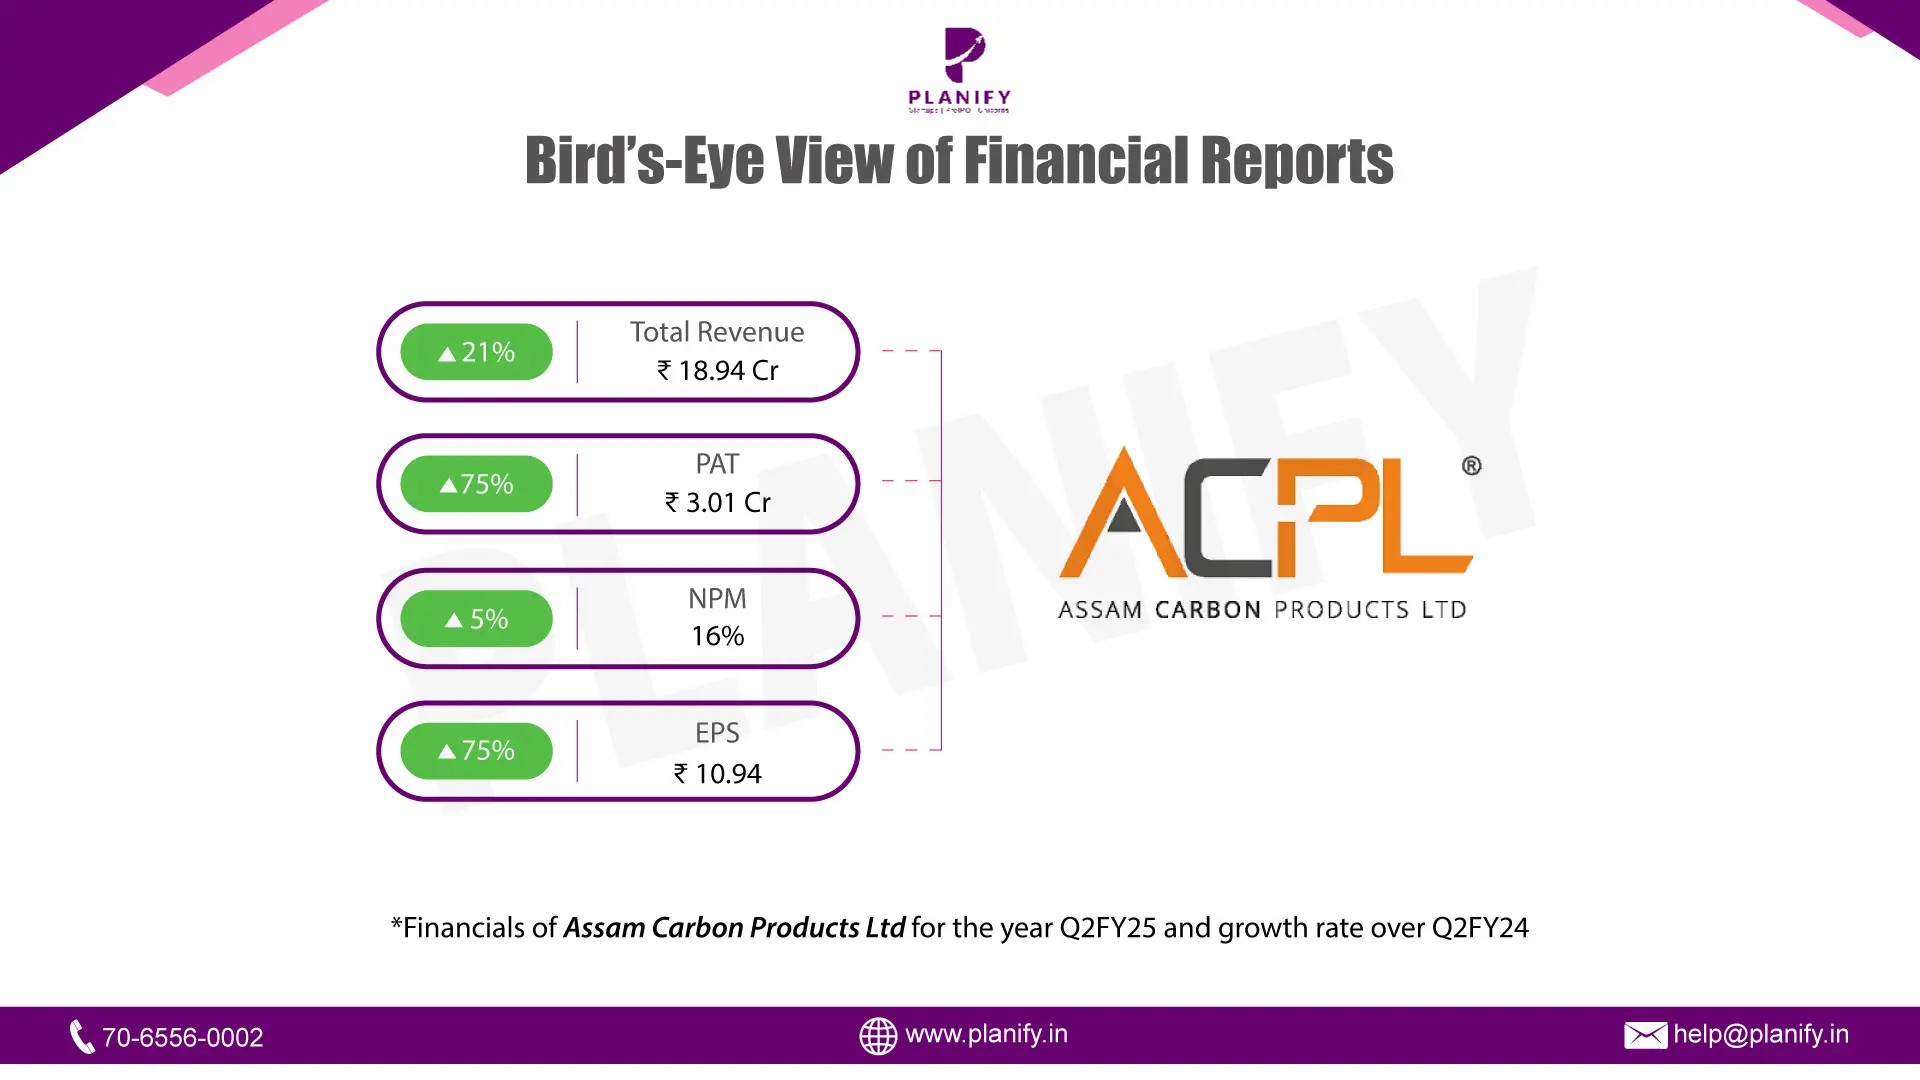
This update provides an overview of Assam Carbon Products Limited's performance for the quarter ended June 30, 2025, highlighting key strategic and operational drivers.
Date: Thu 14 Aug, 2025
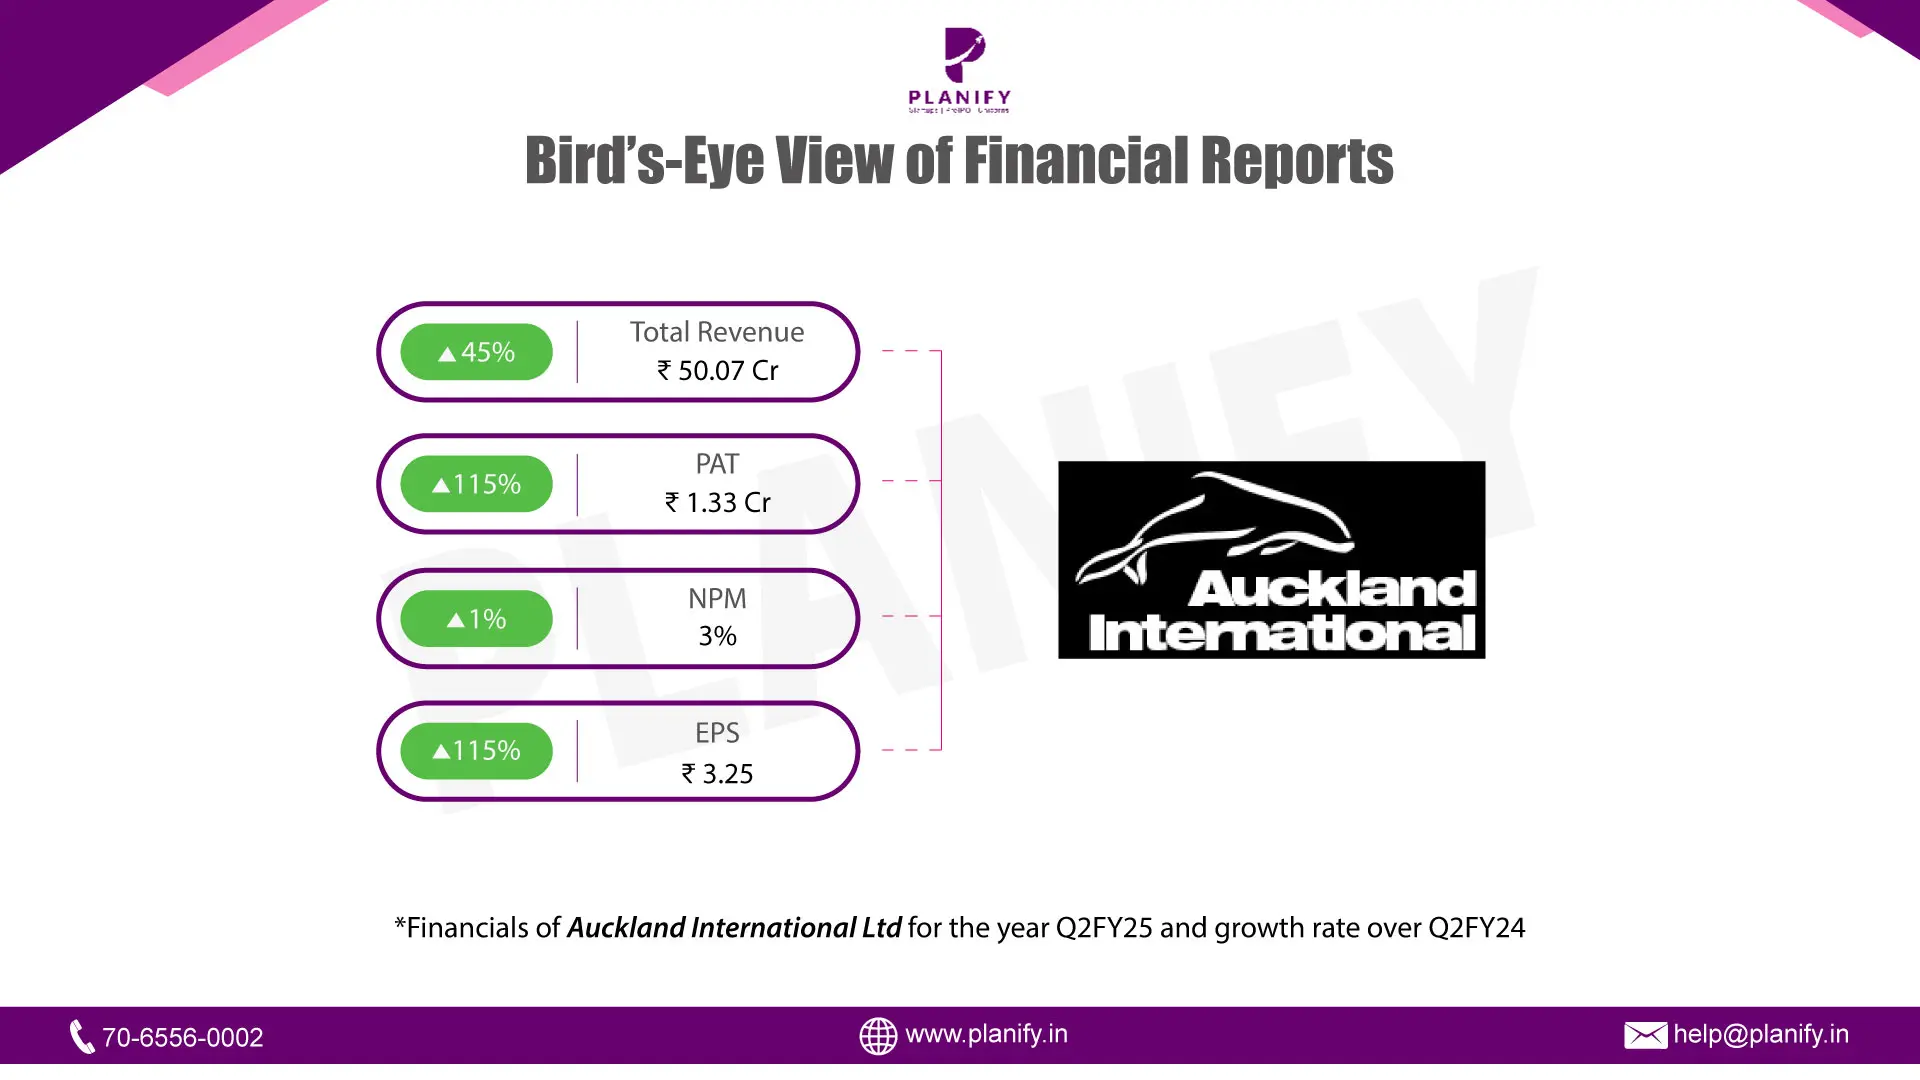
AUCKLAND INTERNATIONAL LIMITED has reported a robust financial performance for the second quarter of Fiscal Year 2025 (Q2FY25) when compared to the same period in the previous year (Q2FY24).
Date: Thu 14 Aug, 2025
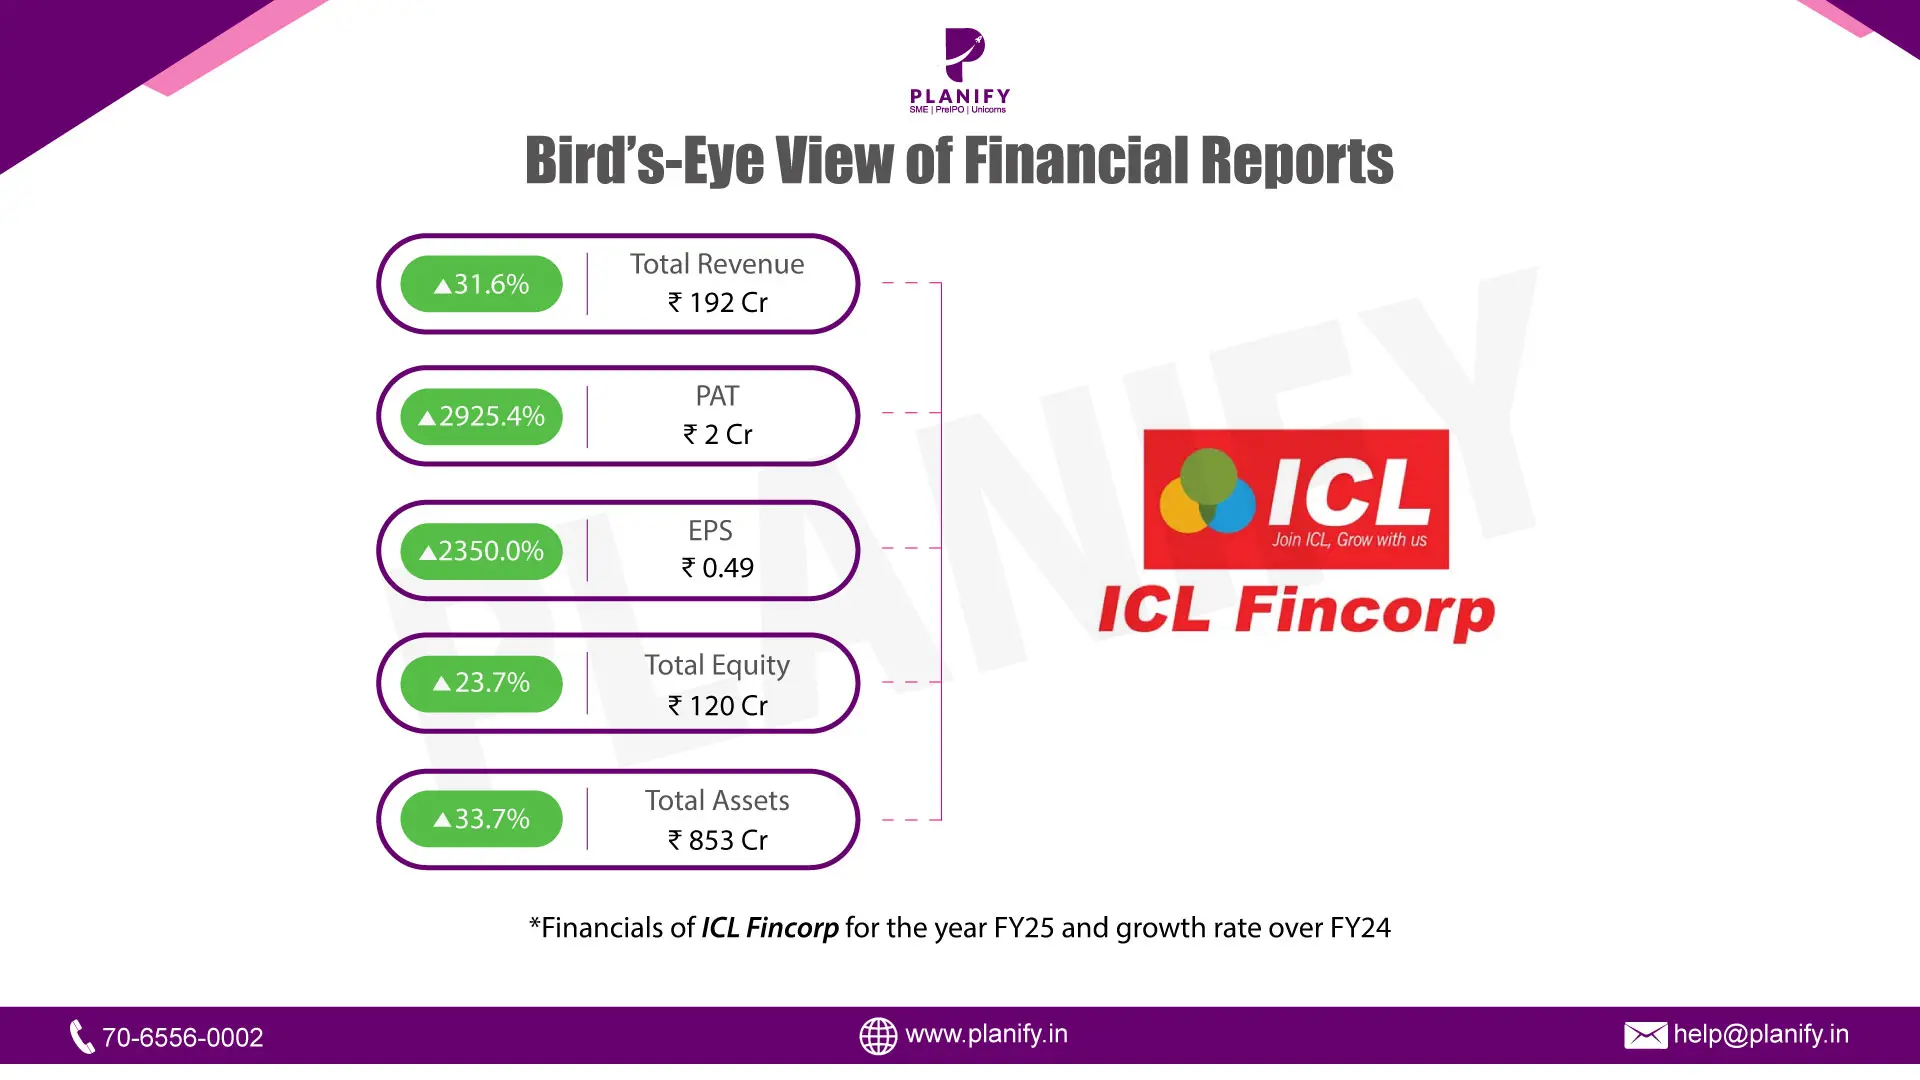
- Financial Performance (FY25 vs FY24): ICL Fincorp posted a strong performance in FY25, recovering sharply from the previous year’s subdued profitability. Total income rose 31.6% to ₹192 Cr from ₹146 Cr in FY24, driven by higher loan disbursements, stronger interest income, and stable fee income. Profit Before Tax (PBT) surged 385.9% to ₹5 Cr from ₹1 Cr, aided by lower impairment costs and operational efficiencies. Net Profit (PAT) surged to ₹2.4 Cr versus ₹8 lakhs last year. Earnings per share (EPS) improved to ₹0.49 from ₹0.02, reflecting a robust earnings rebound.
- Operational Metrics (FY25 vs FY24): The Net Profit Margin jumped to 1.3% from just 0.06%, reflecting a sharp improvement in overall profitability. The loan book expanded by 37.5%, with total assets rising to ₹853 Cr from ₹638 Cr in FY24. Asset quality showed marked improvement – Gross Stage 3 Loan Assets ratio dropped to 1.03% (from 1.51%), and Net Stage 3 Loan Assets ratio improved to 0.88% (from 1.33%). The Capital Adequacy Ratio strengthened to 19.34% (vs 14.99%), while Provision Coverage Ratio increased to 14.17% (vs 12.19%).
- Strategic Developments: In FY25, ICL Fincorp expanded its funding base through multiple secured, redeemable, non-convertible debenture (NCD) issuances via public and private placements, with proceeds fully utilised for business expansion. The company maintained a full asset cover for these NCDs, ensuring strong security for investors. Prudent underwriting standards, better recovery mechanisms, and disciplined cost control supported profitability improvement. Growth was further aided by a stronger capital base, higher borrowings, and increased subordinated liabilities, providing both liquidity and leverage capacity for future expansion.
Date: Wed 13 Aug, 2025
Notice is hereby given that the Extra-Ordinary General Meeting (“EGM”) of Members of B9 Beverages Limited (“BIRA 91”) will be held on Wednesday, September 3, 2025 at 2:00 p.m. (IST) through Video Conferencing (“VC”)/ Other Audio-Visual Means (“OAVM”) to transact the following businesses:
The proceedings of the EGM shall be deemed to be conducted at the corporate office of the company, 7, SCINDIA HOUSE, 1ST FLOOR, K. G. MARG, CONNAUGHT CIRCUS, NEW DELHI – 110001, INDIA which be the deemed venue of the EGM.
Special Business:
To consider, review and if thought fit, to pass, with or without modification(s), the following resolution as a Special Resolution:
- Cancellation of unissued shares of one class and increase in shares of another class and consequent alteration in memorandum of association of the company
- Approval to issue fully paid up, unrated, unlisted, taxable, 866 (Eight Hundred Sixty Six) redeemable non-convertible debentures (“Debentures”) of face value ₹1 lakh each for an amount of Rs. 8,66,00,000/- (Rupees Eight Crore Sixty-Six Lakh Only) to Boston Consulting Group (India) Private Limited on preferential basis for a consideration other than cash
- Approval to issue fully paid up, unrated, unlisted, 3,075 (Three Thousand Seventy Five) Redeemable Optionally Convertible Debentures (“OCDs”) for an amount of up to Rs.30,75,00,000/- (Rupees Thirty Crores and Seventy-Five Lakhs only) to Dharampal Satyapal Limited (“DSL”) on private placement basis.
- Approval to issue 30,76,923 (Thirty Lakh Seventy-Six Thousand Nine Hundred and Twenty-Three) fully paid-up equity shares of face value Rs. 325/- (Rupees Three Hundred and Twenty Five Only) each for an amount of up to Rs. 100,00,00,000/- (Rupees One Hundred Crores Only) to creditors on preferential basis.
Instructions at glance
Cut-off date | Friday, August 08, 2025 |
Commencement of remote e-voting | Sunday, August 31, 2025 at 9:00 AM (IST) |
End of remote e-voting | Tuesday, September 02, 2025 at 5:00 PM (IST) |
EGM | Wednesday, September 03, 2025 at 2:00 PM (IST) |
Date: Wed 13 Aug, 2025
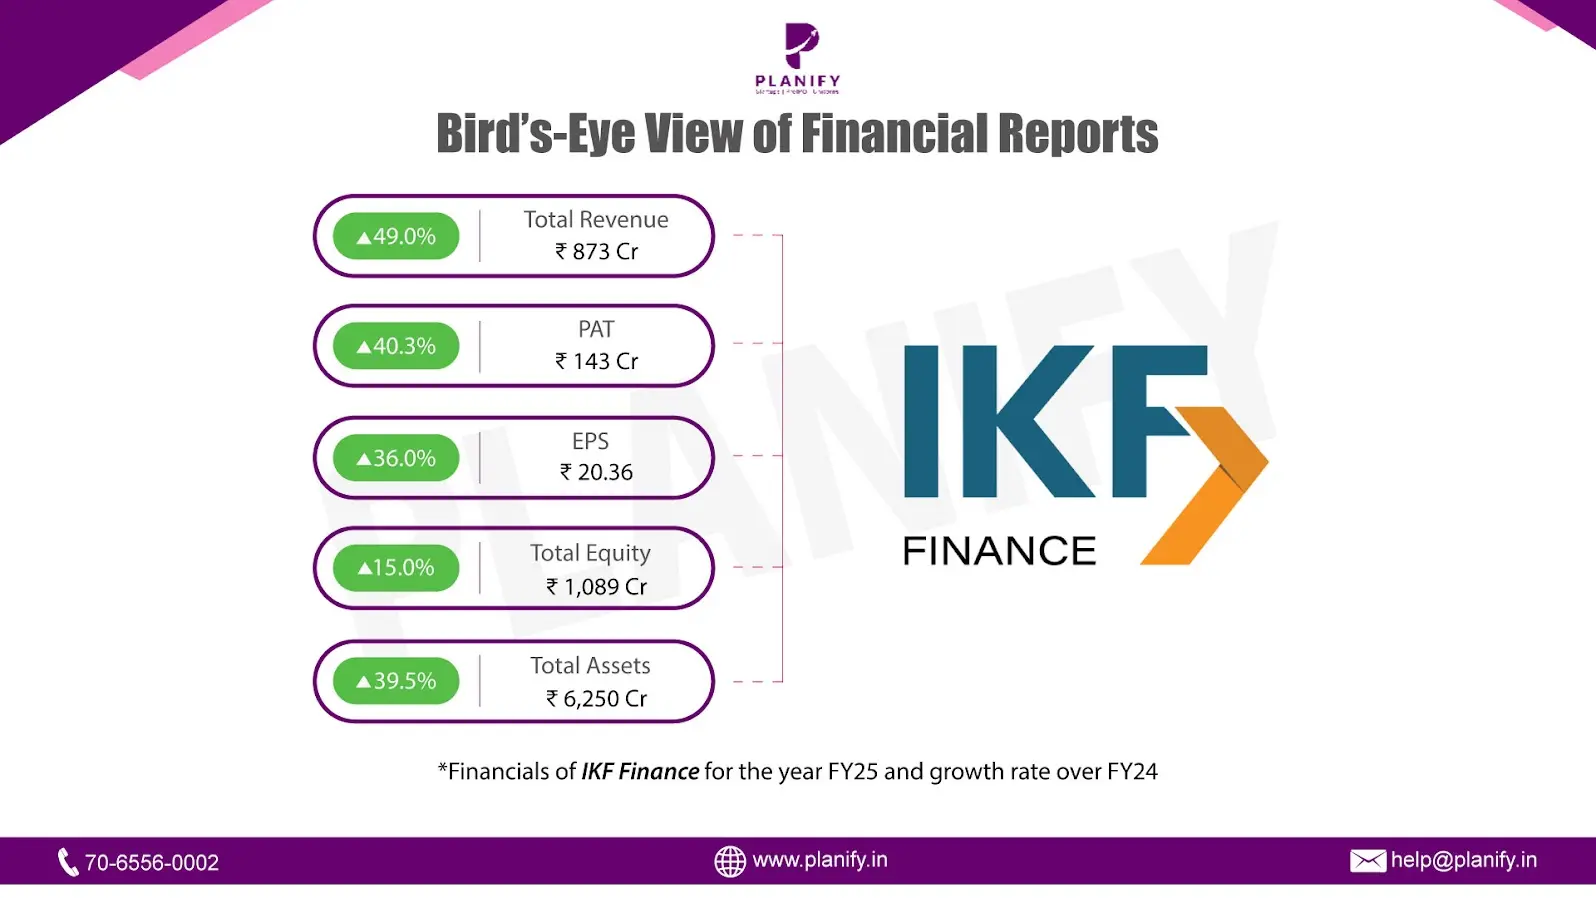
- Financial Performance (FY25 vs FY24): IKF Finance delivered strong growth in FY25 despite higher costs. Total income rose 49.0% to ₹873 Cr from ₹586 Cr in FY24, driven by a sharp 44.3% jump in interest income to ₹775 Cr and a 131% rise in gains on financial instruments under amortised cost to ₹54 Cr. Profit Before Tax (PBT) grew 39.5% to ₹191 Cr from ₹137 Cr last year, supported by revenue growth and Net Profit (PAT) increased 40.3% to ₹143 Cr from ₹102 Cr. Earnings per share (EPS) rose to ₹20.36 (basic) from ₹14.97, a 35.9% improvement YoY, reflecting healthy earnings momentum.
- Operational Metrics (FY25 vs FY24): Net Profit Margin stood at 16.36% vs 17.37% last year, showing a slight dip due to higher finance and impairment costs. Loan book expanded sharply by 37.4% to ₹5,694 Cr from ₹4,143 Cr, reflecting aggressive lending growth. Total debt-to-total assets ratio rose to 80.33% from 76.96%. The sharp 143.7% YoY increase in impairment on financial instruments to ₹49 Cr suggests rising stress in certain loan segments, indicating some pressure on asset quality despite overall portfolio growth.
- Strategic Developments: In FY25, IKF Finance pursued strong growth, expanding its loan book significantly with the help of higher borrowings and a stronger cash reserve. Profits saw healthy growth, but the increase in impairment costs points to some early signs of stress in parts of the loan portfolio. The rise in equity and improved liquidity show that the company is building a solid financial base to support future expansion while keeping stability in focus.
Date: Tue 12 Aug, 2025
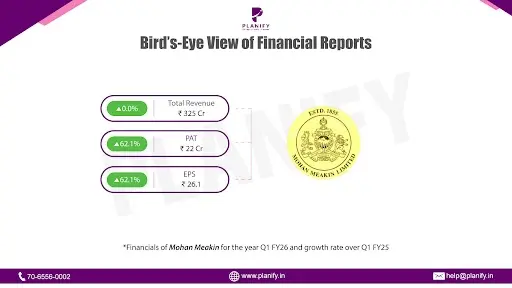
- Financial Performance (Q1FY26 vs Q1FY25): Mohan Meakin reported a marginal decline in Q1FY26, with consolidated revenue from operations slipping 0.8% YoY to ₹319 Cr (vs. ₹322 Cr in Q1FY25). The core alcoholic segment also fell 0.8% YoY to ₹316 Cr (vs. ₹318 Cr), while the non‐alcoholic segment eased 0.7% to ₹3.82 Cr (vs. ₹3.84 Cr), reducing its contribution to 1.2% of operating revenue (vs. 1.3% last year). Total income, including other income, was broadly stable at ₹325.0 Cr (vs. ₹325.1 Cr), supported by a rise in other income to ₹5.6 Cr (from ₹3.3 Cr in Q1FY25), which helped offset the slight drop in operating revenue.
- Operational Metrics (Q1FY26 vs Q1FY25): In Q1FY26, total expenses eased 2.9% YoY to ₹297.5 Cr (vs. ₹306.5 Cr), reflecting effective cost control. Finance costs declined to ₹0.17 Cr (vs. ₹0.20 Cr), further supporting profitability. Profit before tax jumped 59.2% YoY to ₹30 Cr (vs. ₹19 Cr), aided by a one‐time gain of ₹2 Cr from the sale of land. After a tax outgo of ₹7.45 Cr (vs. ₹4.93 Cr), net profit surged 62.0% YoY to ₹22.2 Cr (vs. ₹13.7 Cr), lifting net margins to 6.9% (vs. 4.3% a year ago). Basic EPS rose sharply to ₹26.06 from ₹16.08 in Q1FY25.
- Growth Outlook:Mohan Meakin starts FY26 in a stronger position, with better profits, lower costs, and a solid balance sheet. The alcoholic drinks business will continue to be the main growth engine, and the company can build on this by launching premium products, adding new variants, and reaching more markets. The non‐alcoholic segment, though small, needs fresh ideas or selective cuts to stop its slow decline. While the one‐time land sale helped boost Q1 profits, the main focus will be on keeping operations efficient and improving margins. With very little debt, steady cash flow, and strong assets, the company is in a good place to spend on expanding capacity, promoting its brands, and improving its distribution network, which should support steady and profitable growth ahead.
Date: Tue 12 Aug, 2025
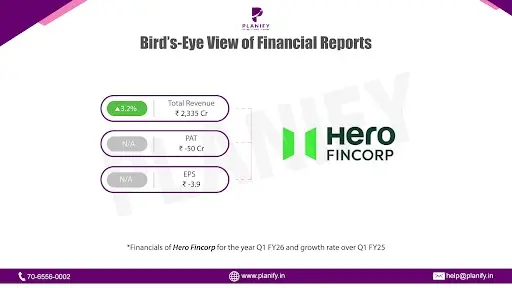
- Financial Performance (Q1FY26 vs Q1FY25): In Q1FY26, Hero FinCorp reported a 3.2% YoY increase in total income to ₹2,335 Cr, up from ₹2,262 Cr in Q1FY25, driven by higher interest income (+1.1% YoY) and other operating charges. However, profitability slipped sharply — Profit Before Tax (PBT) declined to a loss of ₹24 Cr from a profit of ₹89 Cr in Q1FY25, primarily due to higher finance costs (+10.0% YoY to ₹891.1 Cr) and increased impairment on financial instruments (+5.3% YoY to ₹740.3 Cr). Profit After Tax (PAT) fell to a loss of ₹50 Cr from a profit of ₹40 Cr in Q1FY25, weighed down by higher tax expense. EPS dropped to ₹(3.89) from ₹3.10 last year.
- Operational Metrics (Q1FY26 vs Q1FY25): The net loss margin stood at -2.1%, compared to a net profit margin of 1.8% in Q1FY25, reflecting cost pressures. Gross NPA (GNPA) increased to 5.65% from 4.44%, while Net NPA (NNPA) rose to 2.50% from 2.15%, indicating deteriorating asset quality. The Provision Coverage Ratio (PCR) improved to 57.17% from 52.82%, offering a slightly stronger buffer against stressed assets. The capital-to-risk weighted assets ratio (CRAR) rose to 17.67% from 16.93% YoY. The liquidity coverage ratio also improved to 142.46% from 127.93%. Total debts to total assets stood at 86.48% vs 85.81% last year. Net worth declined 1.4% YoY to ₹5,931.7 Cr.
- Strategic Developments: Q1FY26 marked a weak start to the fiscal year for Hero FinCorp, with pressure on margins, rising NPAs, and negative profitability. Higher borrowing costs and provisioning requirements continue to weigh on earnings. The company maintained a healthy liquidity coverage ratio and strengthened its PCR, but sustained improvement in recoveries and tighter credit underwriting will be crucial to reversing the profitability trend. During the quarter, the company completed a private placement of 18,57,135 equity shares at a premium of ₹1,390 per share (face value ₹10), raising ₹1,390 Cr in capital, which will support future growth and balance sheet strength.
Date: Mon 11 Aug, 2025
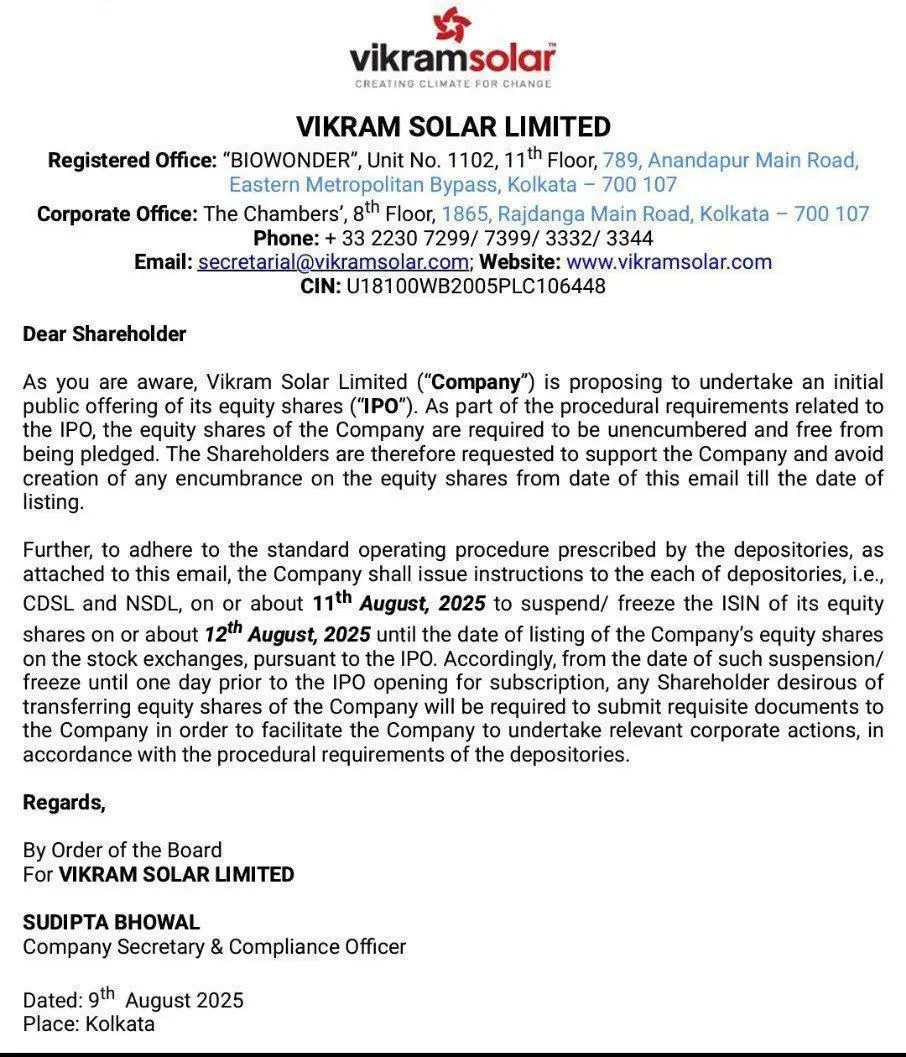
Vikram Solar Limited has informed its shareholders that, in preparation for its upcoming initial public offering (IPO), all equity shares must remain unencumbered and free from pledges until listing.
As part of standard depository procedures, the company will instruct CDSL and NSDL to suspend/freeze the ISIN of its equity shares around 12 August 2025 until listing. During this freeze period, share transfers will require prior documentation and corporate action through the company.
These steps are part of the procedural requirements for a smooth IPO process and listing on the stock exchanges.
Date: Sun 10 Aug, 2025
The National Stock Exchange (NSE) has introduced a 20% lower price cap for Small and Medium Enterprises (SME) Initial Public Offerings (IPOs) during their special pre-open session. This new measure, effective August 4, 2025, complements an existing 90% upper cap over the issue price. The primary goal of these caps is to standardize price discovery and mitigate extreme volatility during the initial trading of SME shares on the NSE Emerge platform.
- This price control mechanism is a significant step towards safeguarding investor interests in the potentially more volatile SME IPO market. By setting clear boundaries for price movement, the NSE aims to prevent sudden and drastic price drops immediately after listing, which could otherwise lead to substantial losses for retail investors. This move fosters a more stable and predictable trading environment for new SME listings.
- The implementation of both an upper and lower band for SME IPOs on the NSE Emerge platform provides a structured framework for price stabilization. According to experts, the price mechanism of the upper and lower band will now limit extreme volatility in the initial trading of SME shares.
- This mechanism is specifically tailored for SME IPOs and does not extend to mainboard IPOs, relisted securities, or public debt, highlighting the targeted effort to address the unique characteristics and risks associated with SME market listings.
Date: Thu 07 Aug, 2025
- Tata Capital Limited (TCL), a leading diversified non-banking financial company (NBFC) in India, has filed its Draft Red Herring Prospectus (DRHP) with SEBI to raise ₹20,000 crore through an Initial Public Offering (IPO). The proposed IPO consists of an Offer for Sale (OFS) of 5.41 crore equity shares by the promoter, Tata Sons Pvt Ltd. There is no fresh issue component in this offering.
- Although the IPO does not aim to raise new capital, the listing is expected to unlock value for the promoter, improve the company's brand visibility, and provide liquidity for existing shareholders, aligning with Tata Sons’ strategic intent to list its major subsidiaries.
- Tata Capital’s lending business is diversified across Retail, Corporate, and Infrastructure Finance. As of March 31, 2025, the company’s Total Gross Loans stood at ₹2,21,950 Cr, growing at a CAGR of 35.0% from FY22 to FY25. The Assets Under Management (AUM) reached ₹2,21,950 Cr in FY25, registering a CAGR of 35.0% over the same period.
- In FY25, Tata Capital recorded a Profit After Tax (PAT) of ₹3,657 Cr, reflecting a CAGR of 26.6% from FY22. This profitability was underpinned by strong loan growth, efficient cost management, and robust asset quality. For FY25, the company achieved a Return on Average Assets (RoA) of 2.07% and a Return on Average Equity (RoE) of 15.56%, underscoring its financial strength and consistent performance.
Date: Wed 06 Aug, 2025
NSE has declared a final dividend of ₹35 per share, including a special one‑time dividend of ₹11.46 per share (face value ₹1), record date of August 13, 2025. The current share price stands at ₹2,255.

Date: Wed 06 Aug, 2025
- Apollo Green Energy Limited has fully repaid the Term Loan facility of ₹125 crore sanctioned by Axis Finance Limited under the sanction letter no. AFL/CO/2023-24/Mar/1838 dated 27th March 2024.
- The repayment, including all outstanding interest, was completed on 1st July 2025. Axis Finance Limited has issued a No Dues Certificate dated 2nd July 2025, confirming that no amount is outstanding under the said facility.
- This repayment reflects Apollo Green Energy Limited’s financial prudence and commitment to timely debt servicing.

Date: Tue 05 Aug, 2025
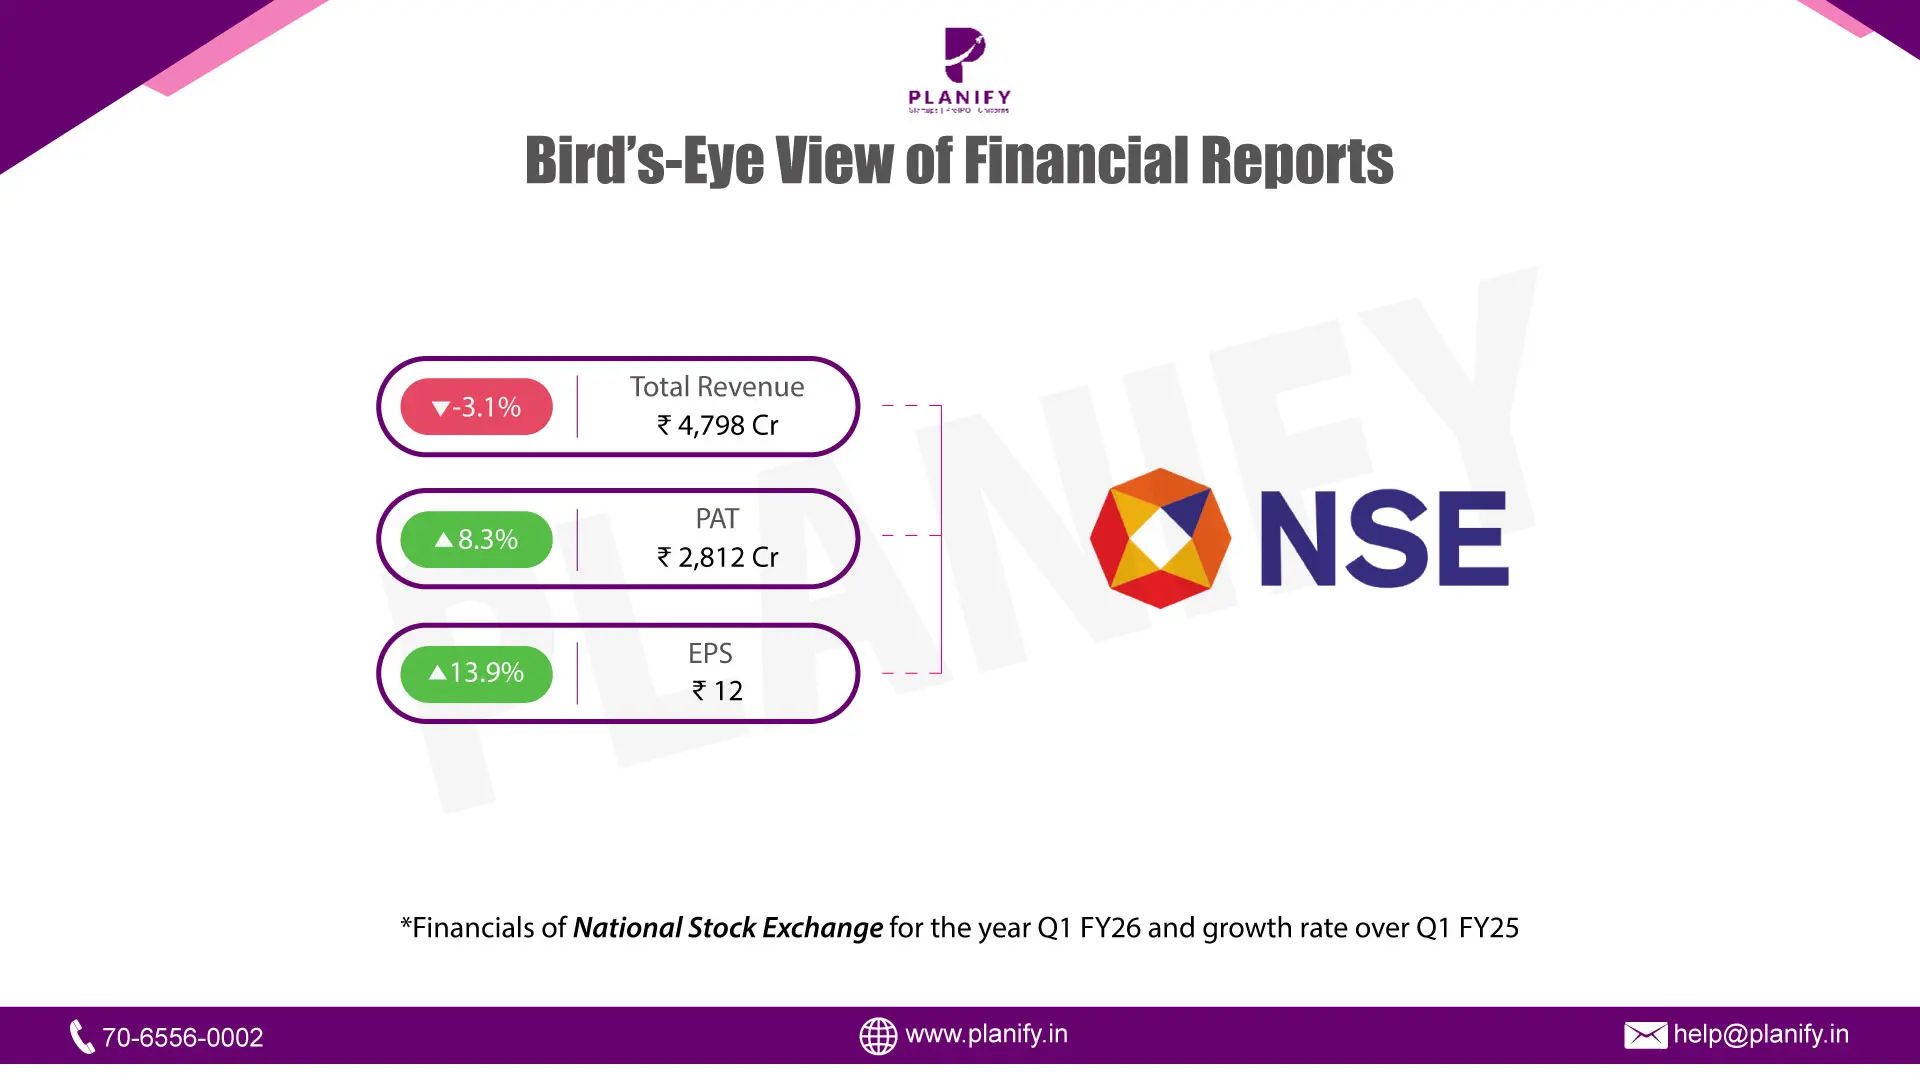
- Financial Highlights: In Q1FY26, the National Stock Exchange of India (NSE) reported a consolidated total income of ₹4,798 crore, marking a 9% QoQ increase, driven primarily by a 7% sequential growth in transaction charges to ₹3,150 crore due to increased trading volumes in both the cash and derivatives markets. Notably, total expenditure decreased by 6% QoQ to ₹1,053 crore, reflecting operational efficiency gains. This led to a 12% QoQ rise in consolidated operating EBITDA to ₹3,130 crore and a 10% rise in net profit to ₹2,924 crore, with EPS improving from ₹10.71 to ₹11.81. Excluding one-offs, normalized PBT rose 12% QoQ to ₹3,683 crore, underscoring strong underlying business momentum.
- Operation Highlights: On a standalone basis, while the reported total income of ₹4,243 crore declined from ₹5,860 crore in Q4FY25 due to one-time dividend income from prior subsidiary divestments, the underlying business showed resilience with a 9% QoQ increase when adjusted for these one-offs. Revenue from operations stood at ₹3,608 crore (up 6% QoQ), supported by higher average daily traded volumes (ADTVs): the cash market surged 14% to ₹1.08 lakh crore, equity futures rose 5% to ₹1.68 lakh crore, and equity options grew 9% to ₹55,514 crore in premium value. Standalone operating EBITDA also rose 11% QoQ to ₹2,714 crore, and normalized PBT increased 13% QoQ to ₹3,141 crore, demonstrating robust core profitability.
- Future Outlook: Looking forward, NSE's continued dominance in trading volumes and market infrastructure positions it strongly amidst a growing equity culture and increasing retail participation in India. Its global leadership in derivatives volumes (ranked #1 globally in 2024 by FIA) and #2 in equity trades (WFE, 2024) reinforces its operational scale. Strategic focus on technology innovation, regulatory compliance, and diversified revenue streams across exchange services, indices, market data, and technology solutions is expected to sustain growth. Its substantial ₹14,331 crore contribution to the exchequer in Q1FY26 reflects its central role in India's financial ecosystem, supporting its long-term outlook.
Date: Thu 31 Jul, 2025
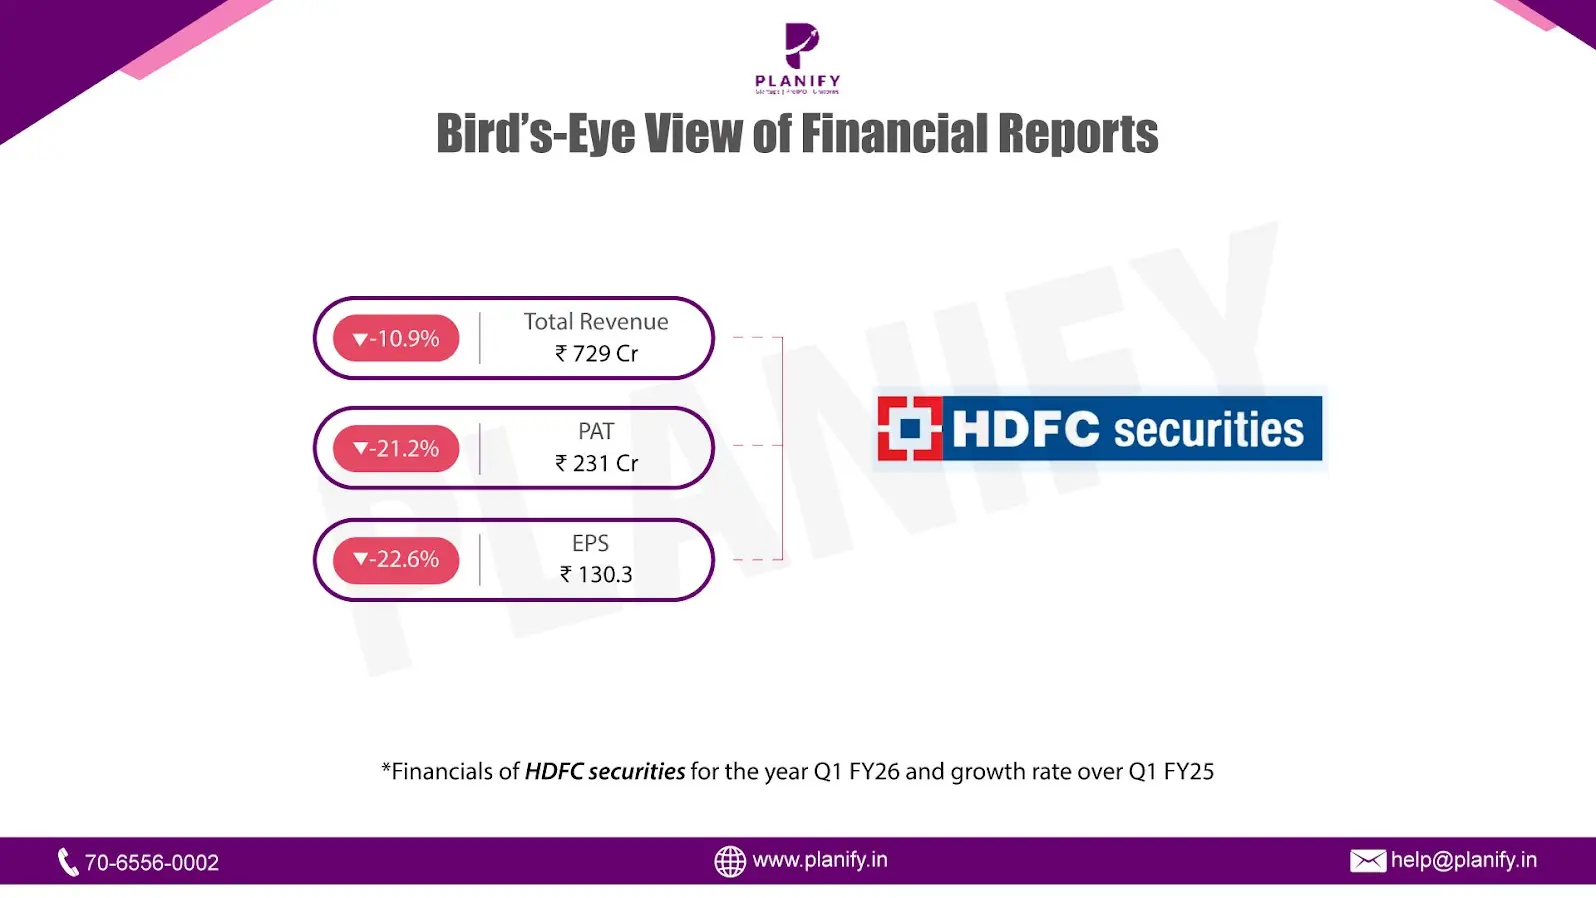
- Financial Performance (Q1 FY26 vs Q1 FY25): HDFC Securities reported a muted financial performance in Q1 FY26, with total revenue declining by 10.9% year-on-year (YoY) to ₹729 Cr from ₹818 Cr in Q1 FY25. This drop reflects softer market volumes and a decrease in transactional revenue. Profit Before Tax (PBT) decreased by 22.3% YoY to ₹304 Cr from ₹391 Cr in the same period last year, primarily due to higher employee and finance costs. Profit After Tax (PAT) stood at ₹231 Cr, down 21.1% YoY from ₹293 Cr, impacting overall profitability. Earnings Per Share (EPS) also dropped by 22.6% YoY, falling to ₹130.3 from ₹168.3 in Q1 FY25.
- Operational Metrics (Q1 FY26 vs Q1 FY25): Operationally, the company faced headwinds. Operating margin compressed to 42% from 48% in Q1 FY25, while Net Profit margin declined to 32% from 36%. The company maintained a healthy Interest Service Coverage Ratio at 3.09x, relatively flat YoY. The debt-to-equity ratio improved to 2.59x from 3.40x, indicating better leverage management. However, the debtors turnover ratio remained subdued at 0.54x vs 0.49x in the same period last year, pointing to working capital pressure.
- Strategic Developments: During the quarter, HDFC Securities allotted 32,262 equity shares under ESOPs and granted 17,250 stock options, reinforcing its employee retention strategy. The company paid an interim dividend of ₹100 per share, amounting to ₹177.7 Cr. A noteworthy event was the contribution from its wholly-owned GIFT City subsidiary (HDFC Securities IFSC Ltd), although the subsidiary posted a minor loss of ₹0.6 Cr this quarter. Despite the drop in revenue and profit, HDFC Securities remains financially stable. Its net worth increased to ₹3,432.5 crore, which is 11.4% higher than the same quarter last year, showing that the company has a strong financial base. It continues to manage its risks carefully, borrow responsibly, and retain a steady client base. These factors should help the company grow over the long term, although lower trading volumes and fee income may impact performance in the near future.
Stay Connected, Stay Informed –
Don’t miss out on exclusive updates, market trends, and real-time investment opportunities. Be the first to know about the latest unlisted stocks, IPO announcements, and curated Fact Sheets, delivered straight to your WhatsApp.