Date: Fri 03 Jul, 2026
India's largest AMC is going public. The DRHP is filed, the regulator has given its nod, and the price band is expected by early July.Β
There is a certain irony in how long this took.
SBI Mutual Fund has been collecting the savings of ordinary Indians since June 1987. That is before most of today's retail investors were born. For nearly four decades, it processed SIP mandates, ran government ETF programmes, managed pension money, and became the country's largest fund house β all without ever opening its books to public shareholders.
That changes now.
On 12 June 2026, SEBI issued its formal observation letter on the draft papers filed by SBI Funds Management Limited. In regulator language, "issuing observations" means approval to proceed. The company had submitted its Draft Red Herring Prospectus on 19 March 2026, and people tracking the offering say the Red Herring Prospectus and price band are likely by July 2β3, give or take market conditions. The IPO is expected to raise around βΉ13,000 crore, and at the valuation being discussed β roughly βΉ1.3 lakh crore β it would make SBI Mutual Fund the largest listed asset manager in the country, not just by AUM but by market capitalisation as well.
This would be the third SBI group entity to hit the exchanges, after SBI Cards and SBI Life Insurance. Both of those turned out to be significant listings. This one is bigger.
A lot of people will hear "SBI Mutual Fund IPO" and think they're buying a piece of the mutual fund schemes themselves. They're not.
What's being offered are shares in SBI Funds Management Limited β the company that manages those schemes, charges the fees, and generates the profits. Think of it this way: when you invest in an SBI Mutual Fund scheme, your money goes into the fund. When you buy shares in this IPO, you're buying equity in the company that runs the fund and earns a management fee from it.
That distinction also explains why the entire offering is structured as an Offer for Sale. SBI (which holds 61.76%) is selling up to 12.83 crore shares. Amundi India Holding (which holds 36.26%) is selling up to 7.54 crore shares. Together, they're offering roughly 20.37 crore shares β about 10% of the company. Not a single fresh share is being issued.
This means SBIFML will receive no money from the IPO. Zero. The proceeds go entirely to the two promoters who are selling.
For investors, this is neither good nor bad on its own. It just means you're evaluating the company on what it already is β a mature, profitable, cash-generating business β not on what it plans to become with new capital. The question is purely one of price.
The Annual Report 2025-26 is the most current audited picture of this business, and the numbers are worth looking at carefully.
Financial Performance β Consolidated (βΉ in Cr)Β
Particulars | FY25 | FY26 | YoY |
Revenue | 3,598 | 4,389 | +21.9% |
Total Income | 4,236 | 4,976 | +17.5% |
PBT | 3,364 | 4,005 | +19.1% |
PAT | 2,540 | 3,067 | +20.75% |
Management Fees | 3,425 | 4,219 | +23.2% |
ROE | 33.7% | 43.02% | +924 bps |
Basic EPS (βΉ)Β | 12.47 | 15.0 | +20.3% |
Diluted EPS (βΉ)Β | 12.44 | 14.96 | Β Β Β +20.3% |
Revenue crossed βΉ4,389 Cr last year. PAT came in at βΉ3,067 Cr up just over 20% from the year before. What catches the eye, though, is the Return on Equity, it jumped from 33.77% in FY2025 to 43.02% in FY2026. For an asset management company at this scale, that is a genuinely strong number. It tells you that as AUM has grown, the business hasn't needed proportionally more capital to generate returns β it's running more efficiently, not less.
Management fees β the core of how an AMC makes money β grew 23.2% to βΉ4,219 Cr. That roughly tracks the growth in assets managed, which is exactly how this model is supposed to work.
Metric | FY2026 | FY2025 |
|---|---|---|
Total QAAUM β All Segments | βΉ29,461.05 billion | βΉ26,275.83 billion |
Total MF QAAUM | βΉ12,509.98 billion | βΉ10,729.49 billion |
QAAUM β Equity Oriented | βΉ5,782.77 billion | βΉ4,947.75 billion |
QAAUM β Fixed Income | βΉ1,712.76 billion | βΉ1,468.55 billion |
QAAUM β Liquid | βΉ959.19 billion | βΉ896.33 billion |
QAAUM β Passives (ETF + Index) | βΉ4,055.26 billion | βΉ3,416.86 billion |
PMS & Advisory QAAUM | βΉ16,878.99 billion | βΉ15,489.86 billion |
AIF QAAUM | βΉ65.65 billion | βΉ50.76 billion |
MF MAAUM β Individual Investors | βΉ5,818.20 billion | βΉ5,163.07 billion |
MF MAAUM β Corporates & Others | βΉ6,331.12 billion | βΉ5,456.82 billion |
MF MAAUM β T30 Cities | βΉ9,376.55 billion | βΉ8,172.80 billion |
MF MAAUM β B30 Cities | βΉ2,772.77 billion | βΉ2,447.09 billion |
Unique Investors | 18.00 million | 14.67 million |
Here's a number that puts things in perspective: the entire Indian mutual fund industry managed roughly βΉ81.6 lakh crore as of May 2026. SBI MF's mutual fund QAAUM alone was βΉ12,509 billion β which is about βΉ12.5 lakh crore. That's roughly one-seventh of the entire industry, sitting in one place.
The second-largest AMC, ICICI Prudential, holds around 13.3% market share. SBI MF holds 15.4%. The gap looks modest in percentage terms, but in absolute AUM the difference is several lakh crore rupees.
Something else worth noting: unique investors grew from 14.67 million to 18 million in a single year. SBI MF added 5.3 million new investors in FY2026. That's not marketing, that's distribution at work β the SBI branch network doing what it does across every town in the country.
SIP Metric | FY2026 | FY2025 |
|---|---|---|
Monthly SIP Flow (AUM) | βΉ40.59 billion | βΉ32.52 billion |
Monthly SIP Transactions | βΉ17.27 million | βΉ13.67 million |
Monthly SIP flows rose from βΉ32.52 billion to βΉ40.59 billion β a 25% jump in a year. Monthly SIP transactions went fromΒ βΉ13.67 million toΒ βΉ17.27 million. Think about what those numbers actually represent: tens of millions of people setting up automated monthly deductions from their bank accounts, trusting SBI MF to manage that money. They're not checking prices daily. They're not reacting to market moves. They just keep investing, month after month.
That predictability of cash flow is one of the most underrated aspects of this business. An AMC with a large SIP book has a revenue stream that doesn't disappear when markets correct. Fees still come in, even if NAVs fall.
SBI Funds Management Limited was incorporated in 1992 and got SEBI's approval to act as investment manager to SBI Mutual Fund in 1993. The company went through its own ownership transitions β a SociΓ©tΓ© GΓ©nΓ©rale Asset Management stake in 2004 that eventually passed to Amundi β and is now a joint venture between two very different but complementary institutions.
State Bank of India needs no introduction. It's India's largest bank by every measure β advances, deposits, branch network. As of December 2025, it had total assets of βΉ78,810 billion, 23,125 branches, and over 96.5 million customers. The YONO app alone has around 96 million users. That's the distribution backbone behind SBI Mutual Fund.
Amundi is less familiar to most Indian retail investors, but it's enormous globally β the largest asset manager in Europe, managing close to β¬2.4 trillion in assets. It brings investment process discipline, risk frameworks, and access to international institutional relationships. SBI MF manages India-focused mandates for institutional investors in Japan, Australia, and Korea, runs UCITS funds distributed across Europe, Middle East, and Southeast Asia, and provides advisory on India-related assets β all leveraging the Amundi relationship.
The company today manages 128 mutual fund schemes, holds 29.6% of India's passive (ETF + index) market β a position it has held since March 2021 β and is also India's largest PMS provider with 39% market share. The Specialised Investment Fund platform, a newer category, has SBI MF at 61% share.
Nine book running lead managers are handling this offering: Kotak Mahindra Capital, Axis Capital, BofA Securities India, HSBC Securities and Capital Markets (India), ICICI Securities, Jefferies India, JM Financial, Motilal Oswal Investment Advisors, and SBI Capital Markets. That's a large syndicate β a reflection of how significant this transaction is considered to be.
The shares will list on both BSE and NSE. The registrar is KFin Technologies.
At around βΉ1.3 lakh crore, the targeted valuation implies a P/E of roughly 51x on FY2026 earnings. HDFC AMC β currently the most premium-rated listed AMC in India β trades somewhere around 45β50x. So SBI MF is being priced at a premium to the premium.
In the pre-IPO grey market, unlisted shares have been changing hands at βΉ850β870 per share, which implies a market cap of βΉ1.75β1.80 lakh crore. Sources suggest the actual IPO price band will be about 20% below that grey market level, bringing the effective valuation closer to βΉ1.3β1.4 lakh crore.
Whether that is fair depends on which lens you use.
If you look at earnings quality β an ROE of 43%, the lowest cost-to-income ratio in the top-10 AMC peer group at roughly 20.6% (FY2025), a PAT margin consistently around 60%, and management fees that have compounded at a strong rate β there's a reasonable case that the business deserves a premium.
If you look at risks β SEBI's new Mutual Funds Regulations effective April 2026 have introduced a Base Expense Ratio with revised fee caps, which will squeeze management fee income going forward; active equity scheme performance has been moderate relative to peers; and the SBI brand, while immensely valuable, is licensed rather than owned by SBIFML, meaning a royalty is paid to use it β the premium starts to feel a bit less comfortable.
Both views are legitimate. The truth probably sits somewhere between them.
There hasn't been a way for retail investors to directly own equity in India's dominant fund house. Until now.
The listed AMC universe has given partial exposure β HDFC AMC, Nippon Life India Asset Management, UTI AMC, Aditya Birla Sun Life AMC all trade on Indian exchanges. But none of them has 15.4% mutual fund market share. None manages βΉ29,000 billion in total assets. And none comes with the SBI bank's distribution behind it.
What an AMC IPO essentially offers is access to a toll road. Every rupee that flows into SBI Mutual Fund's schemes β whether through SIPs, lump sums, institutional mandates, or EPFO flows into ETFs β earns a management fee for SBIFML. As AUM grows, those fees grow. And because the cost base doesn't grow at the same rate as AUM (that's the operating leverage), profits grow faster than revenue. The trajectory of the past three years β PAT growing from βΉ1,340 crore in FY2023 to βΉ3,067 crore in FY2026 β makes that dynamic visible.
India's mutual fund penetration is still low. Only about 4% of the population was a unique investor as of FY2025. As financial literacy improves and tier-2 and tier-3 cities deepen their participation β SBI MF's B30 MAAUM was βΉ2,772 billion in FY2026, already 23% of its total MF MAAUM β the addressable opportunity keeps expanding. SBI MF is better positioned than almost anyone else to capture that expansion, simply because of where its distribution reaches.
The first week of July will matter a lot. When the price band lands, that's the moment to sit down and do the math: what P/E are you paying, how does it compare to HDFC AMC, and what growth rate in earnings do you need to justify that multiple over a five-year horizon?
Look at the anchor investor list when it's disclosed. If you see large domestic mutual funds and prominent FIIs allocating meaningful sizes, that's a signal. If the anchor book looks like it's been filled by friends and allies, that's a different signal.
And if you're a long-term investor β one who doesn't need to exit in six months β this is a business that genuinely compounds well. AUM grows, fees grow, margins expand, dividends come through. It's not exciting. But SBI MF has paid special interim dividends and interim dividends consistently, and the FY2026 dividend payments totalled over βΉ55,000 million to shareholders. That kind of cash return speaks for itself.
SBI Mutual Fund's annual theme for FY2026 was "A Partner for Life." They chose those words deliberately β to describe not just their products but the kind of relationship they want with investors. Decades of SIPs. Retirement corpus. Children's education. The long arc of Indian household aspiration.
There's something almost fitting about the timing. After nearly four decades of managing other people's money, the company is finally ready to let the public manage a piece of it back.
Whether the price is right will depend on a number that isn't known yet. But the business underneath it is real, large, and deeply embedded in how India saves. That, at minimum, is worth understanding clearly.
Date: Thu 02 Jul, 2026
Power Exchange India Limited (PXIL), India's second operational power electronic marketplace regulated by the CERC, is gaining significant attention in the unlisted market with an implied valuation of about βΉ3,100 crore. Promoted by major players like NSE Investments, NCDEX, and Power Finance Corporation, the company runs a digital transaction platform where electricity and energy certificates are traded. This marketplace helps distribution companies (DISCOMs), large industrial units, independent power producers, and open-access consumers manage risk, improve short-term energy procurement, and achieve price discovery transparently and in real time.
PXILβs operations center around a business model that relies on volume-based transaction fees. Unlike stock exchanges that charge based on trade value, PXIL imposes a flat transaction fee linked strictly to physical volume. This fee is typically set at βΉ0.02 per kWh from both buyers and sellers for electricity and a fee of βΉ10 per unit for Renewable Energy Certificates (RECs) and Energy Saving Certificates (ESCerts). PXIL diversifies its core transactional income with recurring revenue from new member registrations, annual subscription fees, software connectivity charges, and interest income from cash reserves. The exchange serves as a central counterparty that collects upfront margins and guarantees settlement, which eliminates counterparty credit risk. This structure provides significant operating leverage; once its digital platform infrastructure is established, incoming trading volumes contribute directly to profits with minimal additional costs.
Financially, the company has had a steady, albeit modest, year. Revenue from operations grew by a solid 12.1%, reaching βΉ86.4 Cr in FY26 compared to βΉ77.1 Cr in FY25. However, total income growth was a bit softer at 8.1%, climbing to βΉ100.4 Cr in FY26 from βΉ92.9 Cr in FY25. This slowdown was due to a decline in interest income from the companyβs large cash reserves, while other income fell by 11.4% to βΉ14.1 Cr. On the expense side, rising employee costs and taxes limited overall earnings growth, keeping total expenses at βΉ50.7 Cr. As a result, Profit After Tax (PAT) showed a modest rise of 7.2%, reaching βΉ37.0 Cr in FY26, up from βΉ34.5 Cr in the previous fiscal year. This increase pushed its Earnings Per Share (EPS) up by 7.3% to βΉ6.34, allowing the company to raise its dividend per share from βΉ1.70 to βΉ2.00.
The primary investment opportunity enhancing this price tag is the upcoming implementation of market coupling under India's power sector reforms. This regulatory change aims to centralize price discovery into a single national pool across all platforms, effectively breaking down the near-monopoly of Indian Energy Exchange (IEX). While the βΉ3,100 crore valuation suggests a high multiple compared to its current trailing earnings (trading at a P/E of roughly 80x to 90x based on the FY26 EPS of βΉ6.34), its backing by institutions, debt-free balance sheet, strong cash reserves, and the significant structural tailwinds of growing power demand in India make it an attractive high-growth option for long-term pre-IPO investors willing to navigate the regulatory changes.

Date: Wed 01 Jul, 2026
Financial Performance (FY26 Provisional numbers vs FY25):
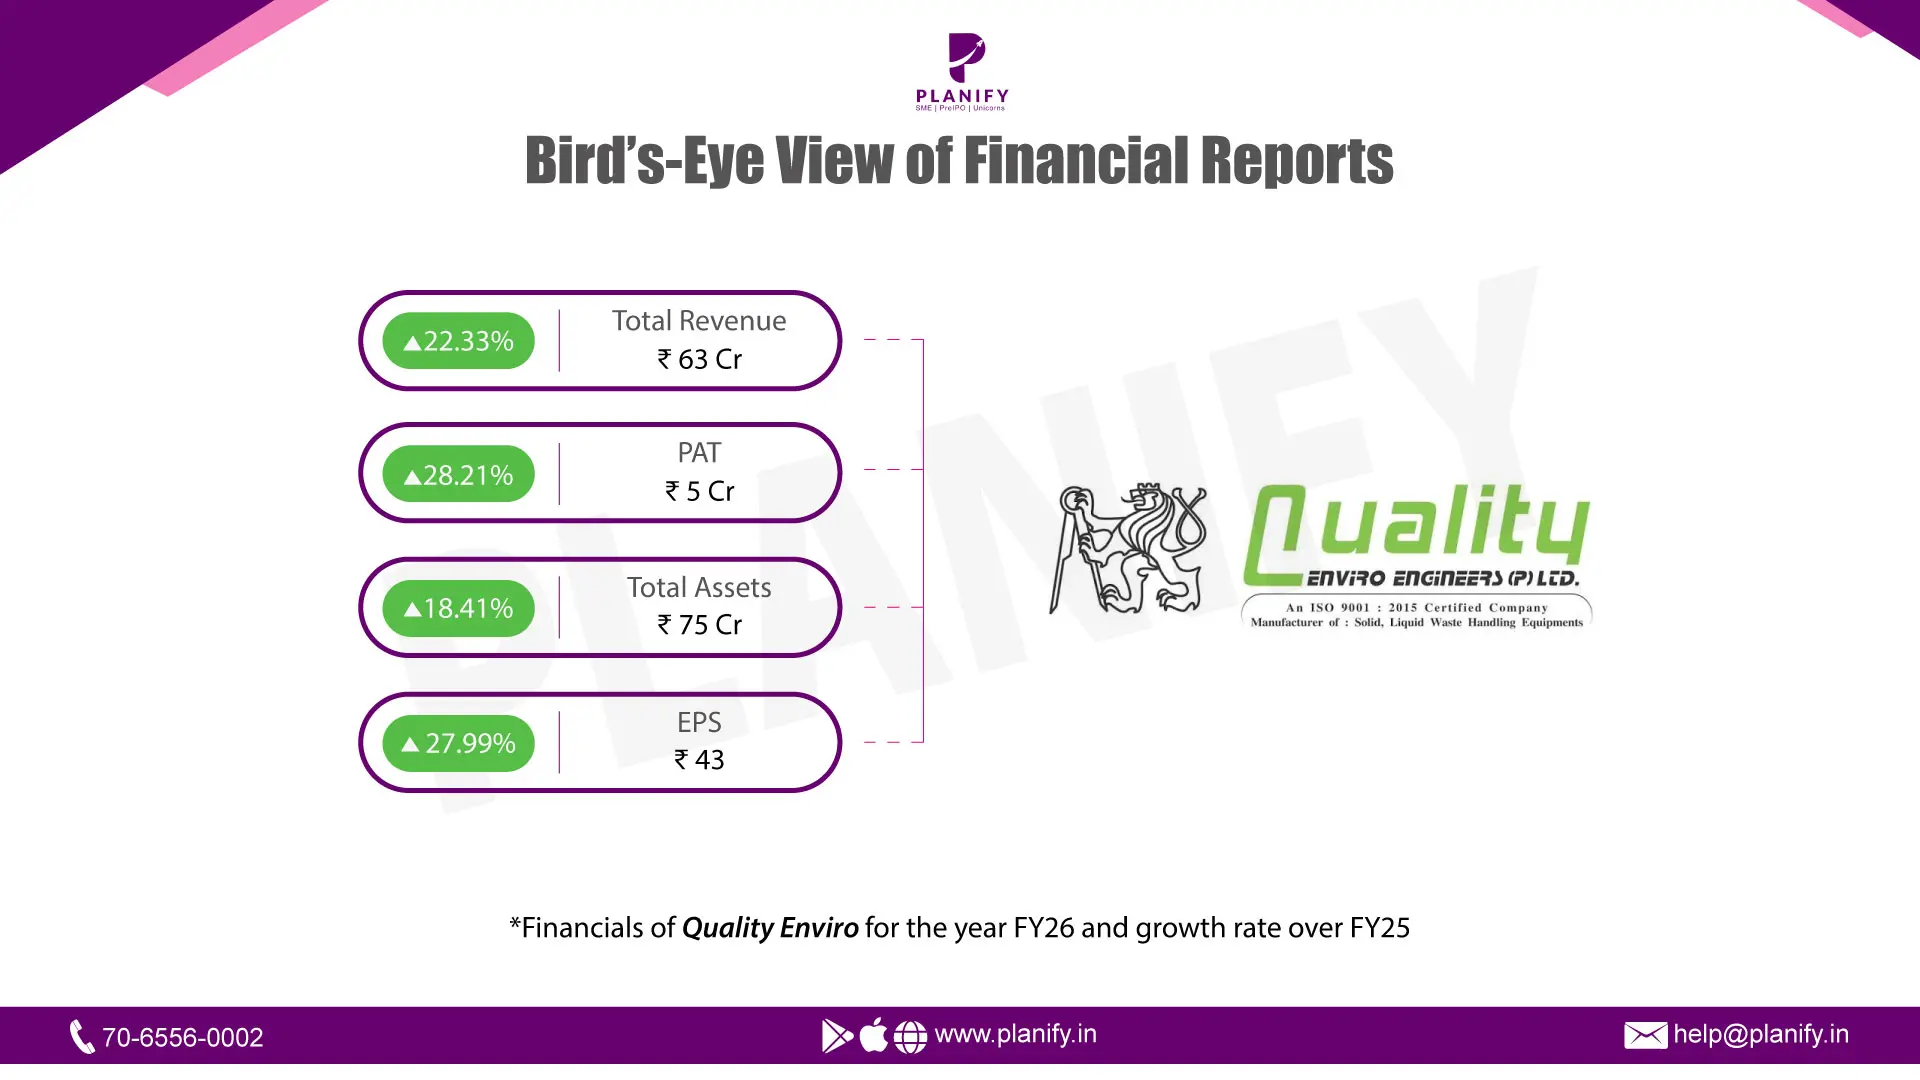
The total revenue of Quality Enviro Engineers Limited has been increasing consistently in FY26, with an increase of total revenue by 22.3%, with its value being βΉ62.99 crore as compared to βΉ51.52 crore in FY25. This was mainly due to efficient project execution along with expanding markets. EBITDA has also been increasing to βΉ7.84 crore in FY26 from βΉ6.41 crore in FY25, while the EBITDA margin has remained constant at 12.45%. Similarly, PAT has increased significantly from βΉ3.93 crore in FY25 to βΉ5.05 crore in FY26. The growth rate for revenue, EBITDA, and PAT has been consistent for the past two financial years, which is 22.3%, 22.3%, and 28.5%, respectively.
Operational Metrics (FY26 Provisional numbers vs FY25)
During FY26, Quality Enviro Engineers Limited increased its unit production to 204 from the previous fiscal year, thereby increasing the manufacturing capacity of the company by 8.5% on a year-over-year basis. The manufacturing capacity of the company stands at 320 units, implying a spare manufacturing capacity of 116 units. The company has scaled its operation on a significant note by increasing its employee strength by 86%, wherein it increased its employee strength to 156 from 84 in the FY26 fiscal year. It has been able to manage its liabilities and assets for its operational growth, whereby the total borrowings are approximately βΉ20 crore against the fixed deposits of βΉ13 crore. To fund further scaling, a banking limit enhancement of +βΉ10 crore is currently planned and in process.
Key Project Executions & Order Book (FY26 Provisional numbers)
Execution of projects as well as pipeline was strong during FY26 with the order book being at more than βΉ14 crore and the bidding pipeline close to βΉ40 crores. The main projects delivered during FY26 include delivery of 7 road sweeping machines worth βΉ11.00 crore for Dhanbad Municipal Corporation and delivery of solar panel batteries & equipment worth βΉ7.00 crore to RCRS Innovations Ltd that marks our strategic entry into the renewables space. Other important executions include fog cannon and desilting machine worth βΉ5.70 crore in Uttar Pradesh, installation and commissioning worth βΉ5.30 crore for TPS Infra, anti-smog gun, jetting machine & sprinklers worth βΉ4.90 crore in Delhi. The ongoing projects in the order book include Delhi MCD (12 anti-smog guns worth βΉ7.20 crore), Chandigarh (5 anti-smog guns worth βΉ2.10 crore), and Belagavi (10 hopper tippers worth βΉ1.30 crore).
Strategic Developments & Outlook
Quality Enviro Engineers Ltd. has remained a leading engineering firm specializing in infrastructural and sanitation related projects. The geographical presence of the firm has expanded to include Delhi, Chandigarh, Haryana, Uttar Pradesh, Manipur, and Vishakhapatnam. In addition to growing its main areas of specialization, which include anti-smog guns, sanitation equipment, jetting machines, and sprinklers, the firm has ventured into making new products including fire rescue vehicles and hopper tippers. Looking forward, the management has set revenue growth guidance of 40-50% year on year (YoY) for FY27 due to a stronger order pipeline and efficient fixed costs absorption. This comes from the commissioning of a new plant by the company.

Date: Wed 01 Jul, 2026
βRenfra Energy Limited (CIN: U74999TN2017PTC119232) is a 2017-founded unlisted company incorporated in Chennai, Tamil Nadu. The company has successfully filed its Draft Red Herring Prospectus (DRHP). Renfra brands itself as a clean energy powerhouse with core competencies in Solar PV EPC, Wind Energy Solutions, Operation and Maintenance (O&M) and Commercial and Industrial (C&I) segments. The Public Issue comprises a Fresh Issue of up to βΉ430.00 Crores and an Offer for Sale (OFS) of up to 47,94,800 Equity Shares, which is proposed to be listed on both the National Stock Exchange of India (NSE) and BSE Limited.
On the financial side ReNfra EnerGy has delivered an explosive profitability unlock with its move to a high-margin Material+Labour contract model that managed to grow its margins from 3% to 13%. The company recorded a strong growth of 104% Year-on-Year with total revenues of βΉ1,040 Crores in FY26. Its Profit After Tax (PAT) has been on a steady upward trajectory over the last four fiscal years, growing from βΉ28 Crores in FY23 to βΉ45 Crores in FY24, βΉ94 Crores in FY25 and over βΉ150 Crores in FY26, which is a 60% YoY growth in the latest fiscal year. In addition, the company has a very decent and strong balance sheet with a low gearing ratio of below 0.5x.
The company's mid to long term earnings visibility is well supported by a strong and active order book of over βΉ900 Crores. This execution pipeline is further bolstered with a major βΉ3,050 Crore Memorandum of Understanding (MOU) inked with the Government of Tamil Nadu. ReNfra EnerGy is a next-growth catalyst with plans to aggressively scale up its execution capacity from 300 MW to 13 GW by FY27. The growth will be propelled by a strategic push into the neighboring states of Karnataka and Andhra Pradesh, which is anticipated to generate a revenue CAGR of 73% over the next four years.
Date: Fri 26 Jun, 2026
Details of the Issue to the Public
Objective of the Issue
Business Model
Jio is built on core pillars of proprietary technology and phygital distribution capabilities enabling us to provide seamless connectivity and digital services to our customers. Its product portfolio includes multiple products offered to business and consumers.
Offerings to Consumers β
Offerings to Business β
Market Share
Since our launch in 2016, JIO has fundamentally reshaped digital connectivity for India, and created an all-internet protocol-led 4G network
for consumers to seamlessly access digital services. In Fiscal 2026, around 60% of Indiaβs wireless data traffic was on our network, and as of March 31, 2026, we were the largest digital connectivity player, followed by Bharti Airtel40 at 35.13%, Vodafone Idea at 12.65%, and BSNL at 2.24%. Jio has successfully transformed Indiaβs digital landscape over the past decade. Before Jio entered in the market in FY2016 average download speed was around 2.5 Mbps and one GB of data cost βΉ228.0 thus average data usage per user was also just 0.2 GB per month. Now, in FY26 download speed reached to over 68 Mbps, data price haveΒ crashed to highly affordable βΉ7.9 per GB, and average monthly usage per customer has expanded exponentially to 25.7 GB. Jio has total customer base of 524.4 million, making it market leader in both mobile and broadband, where it is 1.4 times the size of the Bharti Airtel. This massive user base show deep engagement, with average
per capita data consumption of 42.3 GB and 361.6 million monthly active users across its suite of applications.
Financial Performance Analysis
Financial Metrics:
Particulars | 2024 (Rs Cr) | 2025 (Rs Cr) | 2026 (Rs Cr) |
Total Revenue | 1,10,175.40 | 1,29,333.00 | 1,49,759.10 |
EBITDA | 54,958.70 | 64,170.00 | 76,255.40 |
EBIT | 32,855.60 | 40,032.40 | 49,006.50 |
Net Profit | 21,434.00 | 26,120.30 | 30,052.70 |
Capex | 53,606.70 | 44,349.40 | 34,255.30 |
Total Assets | 5,39,580.40 | 5,81,233.80 | 6,15,594.00 |
Total Debt | 67,110.90 | 85,695.80 | 84,668.60 |
Total Equity | 2,79,421.70 | 3,06,181.20 | 3,37,076.20 |
Free Cashflow | 4,054.90 | 23,806.30 | 43,301.00 |
Key Financial Ratios:
Particulars | 2024 | 2025 | 2026 |
EBITDA Margin | 49.88% | 49.62% | 50.92% |
Net Income Margin | 19.45% | 20.20% | 20.07% |
Return on Capital Employed (ROCE) | 9.48% | 10.22% | 11.62% |
Return on Asset (ROA) | 3.97% | 4.49% | 4.88% |
Return on Equity (ROE) | 7.67% | 8.53% | 8.92% |
Fixed Asset Turnover Ratio | β | 0.29 | 0.33 |
Capex/Revenue | 0.49 | 0.34 | 0.23 |
Debt/Equity | 0.24 | 0.27 | 0.25 |
Interest Coverage Ratio | 8.11 | 8.16 | 5.66 |
Performance Indicator:
Particulars | 2024 | 2025 | 2026 |
Total Consumer (in Rs Cr) | 52.4 | 48.8 | 48.1 |
ARPU | 181.7 | 206.2 | 214 |
Monthly data consumption | 28.7 | 33.6 | 42.3 |
Monthly chur rate | 1.52% | 1.81% | 1.67% |
Date: Fri 19 Jun, 2026
βCare Health Insurance Limited, one of India's leading standalone health insurance providers, has officially opened its much-anticipated rights issue for existing shareholders. The company is aiming to raise nearly βΉ150 crore through the issuance of 93,73,326 equity shares, strengthening its capital base and supporting future growth initiatives.
According to the Letter of Offer issued by the company, eligible shareholders will be able to subscribe to the rights issue in the ratio of 4 equity shares for every 425 fully paid-up equity shares held as of the record date, May 29, 2026. The issue is priced at βΉ160 per share, comprising a face value of βΉ10 and a premium of βΉ150 per share. The total fundraising size stands at approximately βΉ149.97 crore.
The rights issue opened on June 17, 2026, and will remain open until June 24, 2026. Existing shareholders can apply either through the Composite Application Form (CAF) provided by the company or through the Registrar's Web-based Application Platform (R-WAP), subject to eligibility conditions.
The company has stated that the primary objective of the fundraising exercise is to support future business expansion and strengthen its regulatory solvency position. In the insurance sector, maintaining adequate solvency margins is crucial for ensuring financial stability and meeting regulatory requirements set by the Insurance Regulatory and Development Authority of India (IRDAI).
Industry observers believe the capital infusion could help Care Health Insurance further enhance its market presence, invest in technology-driven initiatives, expand distribution networks, and capitalize on the growing demand for health insurance products across India. The Indian health insurance market has witnessed significant growth in recent years, driven by rising healthcare costs, increased awareness about health coverage, and growing penetration in tier-2 and tier-3 cities.
Shareholders who wish to participate in the rights issue are advised to carefully review the offer document, application procedures, and eligibility criteria before making an investment decision. The company has also provided facilities for renunciation and additional share applications in accordance with the terms of the issue.
With the rights issue now underway, investors and market participants will closely monitor subscription levels, which could provide insights into shareholder confidence in Care Health Insurance's long-term growth prospects and strategic direction.
Date: Tue 16 Jun, 2026
The usual way to get on the stock market is pretty straightforward: you build a company get investment bankers file a lot of paperwork do an Initial Public Offering and wait for the market to open.. Onix Renewable Limited is doing things differently. They are using a backdoor method to get listed on the stock market. Onix Renewable Limited is merging with Eureka Industries, which is already listed on the stock market. This way Onix Renewable Limited can avoid all the hassle and cost of doing an Initial Public Offering.
The people who already own shares of Onix Renewable Limited will get one share of the merged entity. This is a good deal for them because they will not lose any value. The people who own shares of Eureka Industries will have to give up some of their shares (only 1 of every 15 shares retained as equity, remaining 14 converted to 0.01% preference shares).Β Because Onix brings a massive 12.96 crore outstanding shares to the table compared to Eureka's modest 87.5 lakh shares, Onix's unlisted shareholders are positioned to become the dominant, controlling owners of the newly listed company.
Onix Renewable Limited is in the energy business, which is really growing in India. By using this backdoor method Onix Renewable Limited can get on the stock market faster than if they did a traditional Initial Public Offering. A traditional Initial Public Offering can take a time sometimes up to a year. Onix Renewable Limited can now raise money on the stock market. The company is doing really well financially. Onix Renewable Limiteds revenue has grown from Rs 351.6 crore to Rs 1,012 crore in FY25. They are also making a lot of profit Rs 112 crore. This will help Eureka Industries, which has been struggling and it will also make Onix Renewable Limited look more credible and visible to investors.
Date: Fri 12 Jun, 2026

Date: Tue 09 Jun, 2026
Introducing GFCL EV Products Limited - a wholly-owned subsidiary of Gujarat Fluorochemicals Limited, one of the renowned entities under the umbrella of INOX Group. GFCL EV has successfully managed to raise more than βΉ2,246 crore by concentrating on producing specialty chemicals in the battery stack rather than entering into the already saturated cell assembly industry. The production of these chemicals demands significant process understanding and expertise. Most of the players who are trying to diversify from China into other regions find themselves trapped due to the fact that they are still dependent on China for their raw material. However, GFCL can easily evade this predicament with the help of its parent company, which has years of experience in manufacturing Anhydrous Hydrofluoric Acid, Lithium Fluoride, and phosphorus pentafluoride.
Whereas most of the global firms choose only one niche for their operations, either the manufacture of anodes or electrolytes, GFCL EV Products Limited is focusing on creating an entire ecosystem within itself. They aim at covering around 70% of the economic value within the Lithium Iron Phosphate battery cells by developing battery salts (LiPFβ, NaPFβ, LiFSI), customized electrolytes, performance additives, LFP cathode materials, natural graphite anodes, as well as binders (PVDF, PTFE).
As a start-up with a high degree of industrial capital requirement, GFCL EV is operating in an aggressive phase of investing where the total capex required is βΉ6,000 crore by FY28. Due to the nature of such an investment phase, it recorded FY26 sales of βΉ33 crore and a loss of βΉ98 crore in the same period. However, the company got validation in the form of a βΉ430 crore investment by the International Finance Corporation of the World Bank Group after going through rigorous due diligence procedures. The critical breakthrough for GFCL was during their May 2026 earning call when the management disclosed that their LiPFβ manufacturing capacity had been sold out to various foreign manufacturers and commercial shipment was underway. The management also predicts achieving quarterly sales in excess of βΉ100 crore by the end of FY27 leading to an annualized run rate of over βΉ400 crore.
Though GFCL seems on track, there is no denying the challenges of dominating the industry as a newcomer. The first of these bottlenecks is the long customer qualification process lasting between 9 and 12 months, which can delay sales.Β GFCL EV is a risky yet time-intensive investment that depends on a diversified global supply chain, sometimes known as the "China Plus One" strategy. India stands to become more than an integral supplier of automotive batteries for the West through this investment because, if it succeeds, India will be an indispensable strategic ally to the Western electric vehicle supply chain.
Date: Tue 09 Jun, 2026
Financial Performance (FY26 vs FY25):
βFrick India Limited reported a mixed financial performance in FY26, with Total Income increasing 8.6% year-on-year (YoY) to βΉ486.20 crore, compared to βΉ447.63 crore in FY25. The growth in revenue reflects an expansion in operations, with revenue from operations rising to βΉ476.53 crore from βΉ436.94 crore in the previous fiscal year. Profitability, however, declined on a YoY basis primarily due to compressed margins and an elevated cost environment. Profit Before Tax (PBT) stood at βΉ26 crore, compared to βΉ46 crore in FY25, while Profit After Tax (PAT) came in at βΉ19 crore, down from βΉ34 crore in the corresponding year last year. The standalone performance in FY26 was also impacted by a non-recurring exceptional charge of approximately βΉ3.22 crore relating to past service costs for statutory gratuity and compensated absences arising from newly notified labor codes.
Operational Metrics (FY26 vs FY25):
The companyβs operational performance remained resilient, with its primary operations continuing to drive the majority of revenues. Revenue from operations stood at βΉ476.53 crore in FY26, compared to βΉ436.94 crore in FY25, reflecting a steady growth in transaction-related income. Segment-wise, the company operates as a single primary business segment viz. manufacture, supply and execution of Industrial Refrigeration and Air conditioning systems. Core sales and operations generated βΉ476.53 crore, compared to βΉ436.94 crore in FY25. Other income contributed βΉ9.67 crore, slightly down from βΉ10.68 crore in the previous year. Despite the increase in revenue, the company witnessed a significant expansion in total expenses, which rose to βΉ455.73 crore, compared to βΉ401.44 crore in the corresponding year last year. This was driven heavily by increased material consumption, as the cost of materials consumed expanded to βΉ355.77 crore from βΉ287.66 crore. Employee benefit expenses also climbed moderately to βΉ68.53 crore from βΉ63.27 crore.
Strategic Developments & Outlook:
Frick India Limited continues to position itself to benefit from structural growth in industrial infrastructure and manufacturing. The company's core refrigeration portfolio provides cross-market scale and business model resilience. Looking ahead, a major milestone includes navigating the integration of the New Labour Codes framework, for which the company has already recorded its estimated impacts. This structural transition, combined with a robust balance sheet featuring a consolidate total equity baseline of βΉ327 crore (up from βΉ308 crore) and an ongoing final dividend declaration of βΉ0.40 per equity share, is expected to support long-term earnings visibility and value creation for shareholders.

Date: Mon 08 Jun, 2026
For a massive breakthrough in Indiaβs renewable industry, Inox Clean Energy, part of the INOXGFL Group, has purchased a whopping 6 GW renewable portfolio from Vena Energy India for a total sum of about βΉ6,000 crore ($715 million). This acquisition will help Inox Clean take a big step towards becoming one of the world leaders in the production of clean energy.
In particular, the portfolio consists of 1.2 GW of currently active green projects, 1.8 GW projects being commissioned soon, and a 3 GW pipeline of future projects. All these projects, however, have already signed power purchase agreements for at least 20 years with leading state-owned organizations such as SECI and GUVNL and various corporates.
The acquisition is a perfect fit for Inox Clean Energyβs goals. Specifically, the company aims at reaching the 10 GW capacity of generation in the field of green energy and 11 GW of solar module manufacturing by the end of 2028. As was stated by Devansh Jain, the Executive Director of the INOXGFL Group, this is the crucial element for building a truly large and integrated platform for renewable energy.
To say Inox has been on a shopping spree lately would be an understatement. Over the last ten months, they have been snatching up green energy companies worldwide including Boviet Solar in the US, Vibrant Energy, SunSource Energy, and SkyPower. With the parent group already backing four publicly traded companies, this rapid expansion looks like a clear sign that Inox Clean is setting the stage for its own stock market debut later this year.
Date: Thu 04 Jun, 2026
β

Date: Thu 04 Jun, 2026
According to sources close to the development, the public market debut could value the travel-tech unicorn at an estimated $7 billion to $8 billion.
The company got the approval from regulators after they secretly filed a Draft Red Herring Prospectus, or DRHP, back in December 2025. On December 20, 2025, special meeting, shareholder gave the company permission to raise up to βΉ6,650 crore by selling new equity shares.
Next Steps and Market Timeline:
Now that SEBI has given the green light, PRISM's next step is to submit its updated draft prospectus, known as the UDRHP-1. As soon as this document is filed, which is expected to happen in early July, it will be made available to the public for a 21-day period, during which time anyone can review and comment on it. This is a required step, and after the comment period is over, PRISM will be able to move forward with its plans. The filing of the UDRHP-1 is a significant milestone, and it's likely that the company is working hard to get everything ready for the upcoming deadline.
The final launch date will ultimately hinge on prevailing market sentiments and institutional appetite. To steer the mega-issue, the company has lined up a heavyweight roster of book-running lead managers, including Axis Capital, Citibank, Goldman Sachs, ICICI Securities, SBI Capital Markets, JM Financial, InCred Capital, and Intensive Fiscal Services.
Pivot to Premium and Stronger Financial Outlook:
The regulatory milestone comes on the back of notable operational shifts and an aggressive global footprint expansion spanning India, Europe, and the United States. PRISM has actively pivoted toward self-operated boutique hotels and premium hospitality tiers, notably through its Sunday Hotels and Palette Hotels brands.
The hospitality company has also recently made a move into India's growing spiritual tourism market, and has started offering high-end vacation rentals in the country by introducing its European brand, DanCenter, in Goa, which is known for its beautiful holiday homes.
Recently, Moody's - a well-known global ratings agency - gave its stamp of approval to PRISM's current path. They confirmed the company's B2 corporate family rating and said they expect things to stay stable. This is largely due to the company's efforts to cut costs, increase premium prices, and successfully bring its huge G6 Hospitality acquisition under its wing. Moody's thinks these moves will really pay off, predicting that PRISM's EBITDA will more than double by FY26 - reaching around $280 million, which is roughly βΉ2,496 crore. This is a big jump and a good sign for the company's future.
In a bid to cement its corporate governance ahead of the public eye, PRISM also recently appointed former SEBI Chairman Ajay Tyagi to its board as an Independent Director.
Date: Tue 02 Jun, 2026
Financial Performance (FY26 vs FY25):
βSchneider Electric President Systems Limited reported a mixed financial performance in FY26, with Total Income declining 15.9% year-on-year (YoY) to βΉ391.39 crore, compared to βΉ465.36 crore in FY25. The moderation in revenue reflects lower trading activity and normalization of market volumes compared to the elevated levels witnessed in the previous year. Profitability declined on a YoY basis primarily due to lower revenue from operations and compressed margins. Profit Before Tax (PBT) stood at βΉ50.66 crore, compared to βΉ65.16 crore in FY25, while Profit After Tax (PAT) came in at βΉ37.73 crore, down from βΉ48.03 crore in the corresponding year last year. The performance in FY26 was also marginally impacted by a non-recurring exceptional charge of approximately βΉ1.36 crore relating to past service costs for statutory gratuity liabilities arising from newly notified labour codes. Excluding this exceptional item, the underlying earnings performance reflects the company's resilient business model in its product and systems segment for electricity distribution.
Operational Metrics (FY26 vs FY25):
The companyβs operational performance remained resilient, with its primary operations continuing to drive the majority of revenues. Revenue from operations stood at βΉ384.23 crore in FY26, compared to βΉ456.99 crore in FY25, reflecting moderation in transaction-related income. Segment-wise, the company operates as a single primary business segment viz. product and systems for electricity distribution. Revenue from core sales and services generated βΉ384.23 crore, compared to βΉ456.99 crore in FY25. Other income (including finance income and miscellaneous gains) contributed βΉ7.17 crore, slightly down from βΉ8.38 crore in the previous year. Despite the decline in revenue, the company maintained tight operational efficiency with total expenses at βΉ339.37 crore, compared to βΉ400.20 crore in the corresponding year last year, indicating controlled cost expansion and reduced raw material consumption, which fell to βΉ243.28 crore from βΉ306.37 crore.
Strategic Developments & Outlook:
Schneider Electric President Systems Limited continues to position itself to benefit from structural growth in Indiaβs electricity distribution and industrial infrastructure markets. The company's core product and system portfolios provide cross-market scale and business model resilience. Looking ahead, a major milestone includes filing a direct listing application to list the company's 1,20,96,000 equity shares on the Main Board of BSE Limited, for which it has already received an in-principle approval dated May 06, 2026. This structural transition, combined with a robust balance sheet featuring an enhanced cash cushion of βΉ106.32 crore (up from βΉ74.29 crore) and ongoing strategic market initiatives, is expected to support long-term earnings visibility and value creation for shareholders.

Date: Mon 01 Jun, 2026
Showing 1-10 of 1763 results
Stay Connected, Stay Informed β
Donβt miss out on exclusive updates, market trends, and real-time investment opportunities. Be the first to know about the latest unlisted stocks, IPO announcements, and curated Fact Sheets, delivered straight to your WhatsApp.