


63sats Cybertech : FY26 Results
Written by: Diksha Kalra
Published: Sep 16, 2026
Updated: Sep 16, 2026
6 min read
Introduction
63SATS Cybertech Limited (formerly 63SATS Global Cyber Technologies Networks Limited) is a Mumbai-headquartered cybersecurity company and a subsidiary of 63 moons technologies limited, founded in 2023. The company offers an integrated portfolio of cybersecurity solutions spanning enterprises, government and critical infrastructure, and individual consumers. Its flagship enterprise offering, Cyber Security Force (CSF), provides unified protection across networks, endpoints, cloud environments and, more recently, AI workloads, while its consumer mobile app, CYBX, equips individual users with tools against phishing, network surveillance and other digital threats, and has crossed close to 19 lakh downloads with over 2 lakh paid subscribers. The company's client base spans BFSI, defence, manufacturing and government, including names such as the Indian Navy, ICICI Securities, Adani Ports, Tata CLiQ, Marico and Lupin. In February 2026, 63SATS raised ₹245 Cr in a Series B funding round (following earlier private placements of ₹180 Cr and ₹65.05 Cr), positioning it to scale product innovation, SOC operations and threat-intelligence capabilities for the AI era.
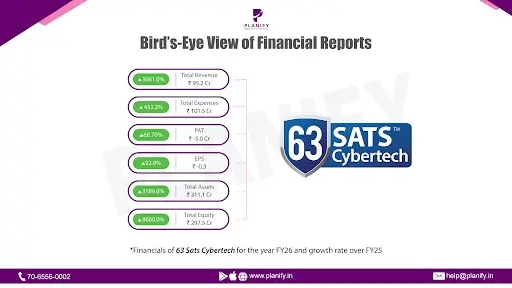
This report presents a summarised analysis of 63SATS Cybertech Limited's financial results for the year ended March 31, 2026, compared with the year ended March 31, 2025. All figures are drawn from the company's audited financial statements and are presented in ₹ Crores for ease of reading. FY26 was a year of rapid scale-up off a very small base: total income grew roughly 31x, from ₹3.01 Cr to ₹95.15 Cr, as the company expanded its enterprise and consumer client base. The company remained loss-making at both the operating and net level, though the net loss narrowed meaningfully (from ₹16.06 Cr to ₹5.03 Cr) even as it continued to invest in people, infrastructure and product development. The balance sheet was transformed by large capital infusions during the year, with total equity swinging from a negative ₹3.50 Cr to a positive ₹297.50 Cr, sharply strengthening the company's solvency position. Given the company's early-stage, loss-making profile, several ratios below (margins, ROE) are negative or not meaningful in the traditional sense, and are presented with that context. The analysis covers headline profitability metrics, a common-size cost structure, key balance sheet items, financial ratios, and a bird's-eye summary view, each accompanied by a brief commentary highlighting the key movements and their implications.
1. Revenue, EBITDA, Net Profit & EPS Summary (₹ in Cr)
Particulars | FY26 | FY25 | YoY Change |
Revenue (Total Income) | 95.15 | 3.01 | +3,061% (~31x) |
EBITDA | (3.88) | (15.18) | + 74.4% |
EBITDA Margin | -4.08% | -504.3% | +500.2 % |
Net Profit / (Loss) | (5.03) | (16.06) | +68.7% |
NP Margin (NPM) | -5.29% | -533.6% | +528.3 % |
EPS (Basic & Diluted, ₹) | (0.26) | (3.68) | + 92.9% |
Revenue scaled roughly 31x off a very small FY25 base, reflecting the company's rapid enterprise and consumer client acquisition during the year. Despite this, both EBITDA and net profit remained negative - the company is still in an investment-heavy growth phase - but losses narrowed sharply (net loss fell ~69%) as revenue began to catch up with the fixed cost base built out during the year.
2. Common-Size Statement (as % of Revenue)
Particulars | FY26 (₹ Cr) | FY25 (₹ Cr) |
Property, plant and equipment | 20.21 | 0.28 |
Investments (current) | 86.93 | 3.58 |
Trade receivables | 58.21 | 0.44 |
Cash and cash equivalents | 33.32 | 1.07 |
Borrowings (total) | 2.57 | 10.11 |
Trade payables (total) | 4.47 | 0.98 |
In FY25, the company's cost base - especially employee expense, at over 3.6x revenue - far outstripped its still-nascent revenue, typical of an early-stage business investing ahead of scale. By FY26, with revenue up ~31x, employee cost fell to ~20% of revenue and finance cost to under 2%, showing early signs of operating leverage even though the business is not yet profitable. Cost of Goods Sold appears only in FY26, consistent with the ramp-up in enterprise product/hardware-linked revenue.
3. Key Balance Sheet Items (₹ in Cr)
Particulars | FY26 (₹ Cr) | FY25 (₹ Cr) |
|---|---|---|
Property, plant and equipment | 20.21 | 0.28 |
Investments (current) | 86.93 | 3.58 |
Trade receivables | 58.21 | 0.44 |
Cash and cash equivalents | 33.32 | 1.07 |
Borrowings (total) | 2.57 | 10.11 |
Trade payables (total) | 4.47 | 0.98 |
The balance sheet expanded dramatically on the back of the FY26 capital raise - PPE grew over 70x as the company built out infrastructure, while cash, investments and receivables all scaled with the business. Encouragingly, borrowings actually fell (from ₹10.11 Cr to ₹2.57 Cr) even as the company grew, meaning growth and infrastructure build-out were funded almost entirely through fresh equity rather than debt.
4. Key Ratio Analysis
Ratio | FY26 | FY25 | YoY Change |
|---|---|---|---|
Net Profit Margin | -5.29% | -533.6% | +528.3% |
Return on Equity (ROE) | -1.69% | - | - |
Fixed Asset Turnover Ratio | 4.71x | 10.75x | -6.04x |
Debt-to-Equity Ratio | 0.01x | - | - |
Most FY25 ratios are not meaningful because the company had negative shareholders' equity that year - a common feature of early-stage, loss-funded businesses. The picture that matters is the FY26 turnaround in the balance sheet: equity turned strongly positive, leverage is now negligible (D/E of ~0.01x), and while ROE remains slightly negative, it has moved from a fundamentally unstable base to a stable, well-capitalised one.
Stay Connected, Stay Informed –
Don’t miss out on exclusive updates, market trends, and real-time investment opportunities. Be the first to know about the latest unlisted stocks, IPO announcements, and curated Fact Sheets, delivered straight to your WhatsApp.


Planify Enterprises Private Limited
Planify Capital Limited
Licensed By




Mutual Fund License No.:
ARN-164419
IRDA Code (1):
ABLIC1003123454
IRDA Code (2):
ABLIC1003131639
Startup India Certificate No.:
DIPP93786
Other Websites


ⓒ 2016-2026 Planify. All rights reserved, Built with
in India


