


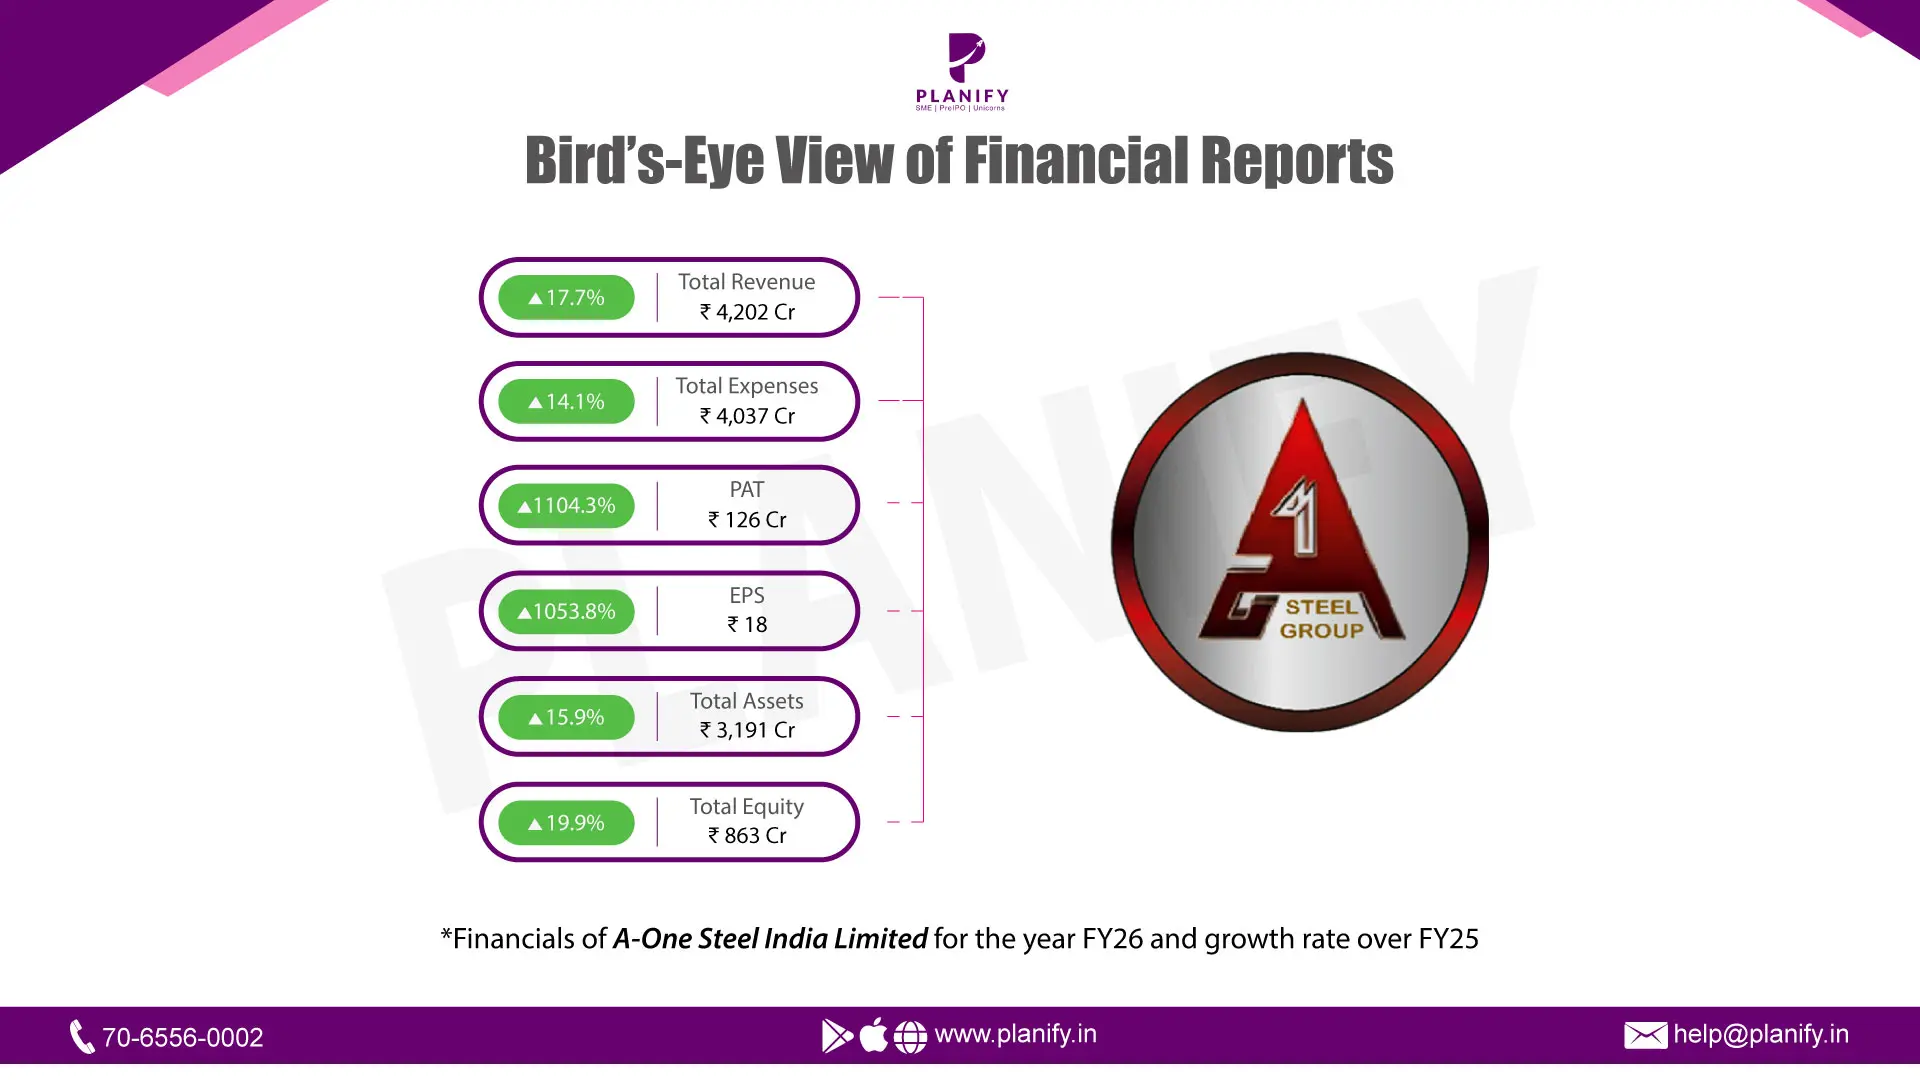
A- One Steel India Limited: FY26 comes with a strong performance but with a working capital warning. Is the company facing any cash crunch?
Written by: Diksha Kalra
Published: Sep 16, 2026
Updated: Sep 16, 2026
5 min read
A- One Steel India Ltd. was established in 2009 under the vision of Mr. Krishan Kumar Jallan. It is a backwards-integrated steel manufacturing company in southern India with a diversified product portfolio in both long and flat steel products and industrial products used in steel manufacturing. The company has a total installed capacity of 1.497 million metric tonnes per annum. The company is one of the top 5 (five) steel producers in southern India in terms of crude steel capacity.
A-One Steel have six manufacturing facilities of which five are located in Karnataka and one in Andhra Pradesh. Company's manufacturing facilities are located at Gauribidanur, Bellary, Koppal, and Chikkantapur in Karnataka and Hindupur in Andhra Pradesh.
A- One Steel India has published its performance for the financial year 2026.FY26 was a strong turnaround year for the company: revenue grew ~17.7% to ₹4,202 Cr, while EBITDA and net profit grew far faster (+70% and over 11x, respectively), driving a marked improvement in margins and return ratios.
1. Revenue, EBITDA, Net Profit & EPS Summary (₹ in Cr)
Particulars | FY26 | FY25 | YoY change |
Total Revenue | 4,202 | 3,569 | +17.7% |
EBITDA | 339 | 199 | +70% |
EBITDA Margin | 8% | 5.6% | +2.5 pp |
Net Profit | 125 | 10 | +1,104% |
NP Margin | 2.99% | 0.29% | +2.7 pp |
EPS | 18 | 1.58 | +1,053% |
Revenue grew a healthy 17.7%, but the real story is operating leverage - EBITDA grew nearly 4x faster than revenue (+70%), lifting margin by 2.5 pp. This flowed through to the bottom line, with net profit rising over 11x, aided by FY25's one-off fire-damage loss not repeating and finance costs holding flat despite a larger balance sheet.
2. Common-Size Statement (as % of Revenue, ₹ in Cr)
Particulars | FY25 (₹Cr) | FY25 (% revenue) | FY26 (₹Cr) | FY26 (%revenue) |
Total Revenue | 3,569 | 100% | 4,202 | 100% |
Cost of materials consumed | 3,054 | 85.5% | 3,487 | 82.9% |
Employee benefit expense | 48 | 1.37% | 53 | 1.26% |
Finance costs | 111 | 3.1% | 111 | 2.64% |
Depreciation & amortisation | 56 | 1.57% | 62 | 1.49% |
Material cost fell around 2.6 pp as a share of revenue, the single biggest driver of the EBITDA margin expansion. Finance cost also eased by 0.5 pp despite a larger balance sheet, while employee cost and depreciation remained broadly stable as a proportion of revenue.
3. Key Balance Sheet Items (₹ in Cr)
Particulars | FY26 | FY25 |
Property, plant and equipment | 633 | 569 |
Inventories | 899 | 797 |
Trade receivables | 664 | 437 |
Cash and cash equivalents | 25 | 11 |
Current borrowings | 674 | 680 |
Non-current borrowings | 336 | 282 |
Trade payables | 965 | 765 |
.
Trade receivables grew by 52%, far outpacing revenue growth (18%) - suggesting that though revenue and profits have expanded significantly in FY26 but the company faces difficulty in collecting cash. However, trade payables also grew 26%, indicating part of the receivables build-up was funded by stretching suppliers rather than drawing on working capital lines.
4.Key Ratio Analysis
Particulars | FY26 | FY25 | YoY change |
Net Profit Margin | 2.99% | 0.29% | +2.70 pp |
Return on Equity | 14.5% | 1.45% | +13.11 pp |
Fixed Asset Turnover Ratio | 6.6x | 6.2x | +0.36x |
Debt-to-Equity Ratio | 1.17x | 1.34x | -0.17x |
ROE's sharp jump is largely a low-base effect from a weak FY25. The Debt-to-Equity ratio actually improved (fell 0.17x) even as the balance sheet grew; the growth was funded more by retained earnings than fresh debt. Fixed asset turnover rose only modestly, consistent with FY26's profit growth being margin-led rather than driven by significantly better asset utilisation.
Stay Connected, Stay Informed –
Don’t miss out on exclusive updates, market trends, and real-time investment opportunities. Be the first to know about the latest unlisted stocks, IPO announcements, and curated Fact Sheets, delivered straight to your WhatsApp.


Planify Enterprises Private Limited
Planify Capital Limited
Licensed By




Mutual Fund License No.:
ARN-164419
IRDA Code (1):
ABLIC1003123454
IRDA Code (2):
ABLIC1003131639
Startup India Certificate No.:
DIPP93786
Other Websites


ⓒ 2016-2026 Planify. All rights reserved, Built with
in India


