


GKN Driveline India - FY26 Results
Written by: Diksha Kalra
Published: Sep 16, 2026
Updated: Sep 16, 2026
5 min read
Introduction
GKN Driveline (India) Limited, incorporated in 1985 and headquartered in Faridabad, Haryana, is an automotive components manufacturer and part of GKN Automotive, the global driveline technology and systems business now operating under the UK-based Dowlais Group (demerged from the former GKN plc / Melrose Industries in 2023). GKN Driveline International holds a majority stake in the Indian entity. The company manufactures constant velocity joints, propshafts and connecting shafts, and drive axle assemblies for passenger cars and light commercial vehicles, supplying original equipment manufacturers both in India and overseas, and draws on a technical collaboration with GKN Driveline International, Germany, for its product and process technology. The company operates five manufacturing plants across India.
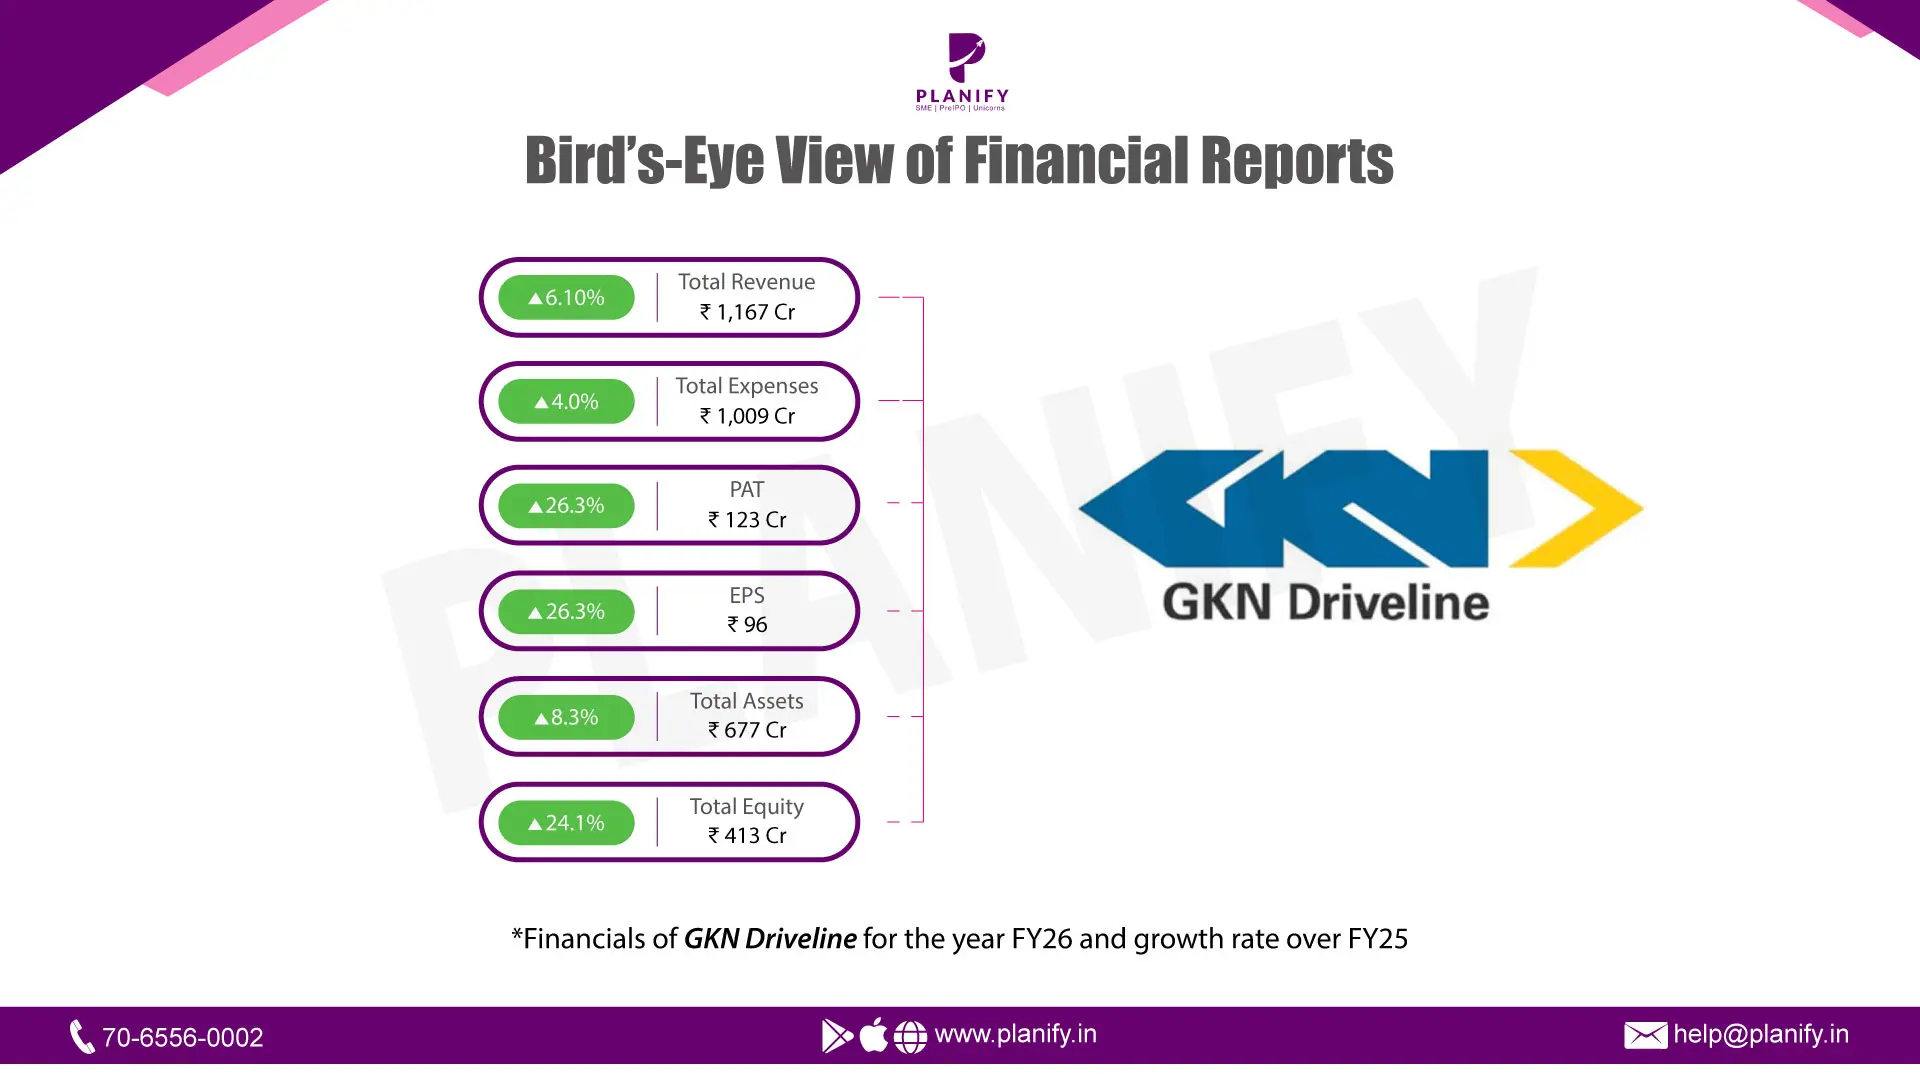
This report presents a summarised analysis of GKN Driveline (India) Limited's financial results for the year ended March 31, 2026, compared with the year ended March 31, 2025. FY26 was a year of profitable growth: revenue grew a modest 6.1% to ₹1,167 Cr, while net profit grew much faster at 26.3% to ₹123 Cr, aided by a decline in cost of materials as a share of revenue and a favourable movement in deferred tax. This drove a meaningful expansion in both EBITDA margin (+2.0 pp) and net profit margin (+1.7 pp). A distinctive feature of the balance sheet is that the company carries no borrowings in either year, funding its operations and growth entirely through equity and internal accruals — total equity grew ~24.1% during the year on the back of retained profits. The analysis below covers headline profitability metrics, a common-size cost structure, key balance sheet items, financial ratios, and a bird's-eye summary, each accompanied by brief commentary highlighting key movements and their implications.
1. Revenue, EBITDA, Net Profit & EPS Summary (₹ in Cr)
Particulars | FY26 | FY25 | YoY Change |
Revenue (Total Income) | 1,167 | 1,100 | +6.1% |
EBITDA | 209 | 175 | +19.4% |
EBITDA Margin | 17.9% | 15.9% | +2.0 % |
Net Profit (PAT) | 123 | 97 | +26.3% |
NP Margin (NPM) | 10.5% | 8.8% | +1.7 % |
EPS (Basic & Diluted, ₹) | 96.12 | 76.08 | +26.3% |
Revenue grew a modest 6.1%, but profitability grew much faster — EBITDA rose 19.4%, and PAT rose 26.3% — pointing to a genuine improvement in operating efficiency rather than growth alone. EBITDA margin expanded by 2.0% and net margin by 1.7%, aided by lower material costs and a favourable tax outcome, discussed further below.
2. Common-Size Statement (as % of Revenue, ₹ in Cr)
Particulars | FY25 (₹ Cr) | FY25 (% of Rev) | FY26 (₹ Cr) | FY26 (% of Rev) |
Revenue (Total Income) | 1,100 | 100.0% | 1,167 | 100.0% |
Cost of materials consumed | 576 | 52.4% | 594 | 50.9% |
Employee benefit expense | 143 | 13.0% | 158 | 13.5% |
Finance costs | 2.54 | 0.2% | 6.68 | 0.6% |
Depreciation & amortisation | 42 | 3.8% | 44 | 3.8% |
Cost of materials consumed eased from 52.4% to 50.9% of revenue - the single biggest driver of the margin expansion seen in Table. Employee cost ticked up slightly as a share of revenue, while depreciation stayed flat. Finance costs, though still very small in absolute terms, roughly tripled as a share of revenue (0.2% to 0.6%); given the company carries no borrowings, this rise likely reflects higher lease-related interest under Ind AS 116 rather than fresh debt.
3. Key Balance Sheet Items (₹ in Cr)
Particulars | FY26 (₹ Cr) | FY25 (₹ Cr) |
Property, plant and equipment | 257 | 258 |
Inventories | 110 | 99 |
Trade receivables | 162 | 136 |
Cash and cash equivalents | 89 | 66 |
Current borrowings | Nil | Ni |
Non-current borrowings | Nil | Nil |
Trade payables (total) | 184 | 184 |
GKN Driveline's balance sheet stands out for carrying zero borrowings in both years — a genuinely debt-free capital structure. PPE stayed broadly flat, while inventories, receivables and cash all grew roughly in line with or slightly ahead of revenue growth. Trade payables were essentially unchanged YoY, suggesting stable supplier payment terms even as working capital on the asset side expanded modestly.
4. Key Ratio Analysis
Ratio | FY26 | FY25 | YoY Change |
Net Profit Margin | 10.5% | 8.8% | +1.7 pp |
Return on Equity (ROE) | 29.8% | 29.2% | +0.5 pp |
Fixed Asset Turnover Ratio | 4.54x | 4.26x | +0.28x |
Debt-to-Equity Ratio | 0.00x | 0.00x | No change |
Stay Connected, Stay Informed –
Don’t miss out on exclusive updates, market trends, and real-time investment opportunities. Be the first to know about the latest unlisted stocks, IPO announcements, and curated Fact Sheets, delivered straight to your WhatsApp.


Planify Enterprises Private Limited
Planify Capital Limited
Licensed By




Mutual Fund License No.:
ARN-164419
IRDA Code (1):
ABLIC1003123454
IRDA Code (2):
ABLIC1003131639
Startup India Certificate No.:
DIPP93786
Other Websites


ⓒ 2016-2026 Planify. All rights reserved, Built with
in India


