


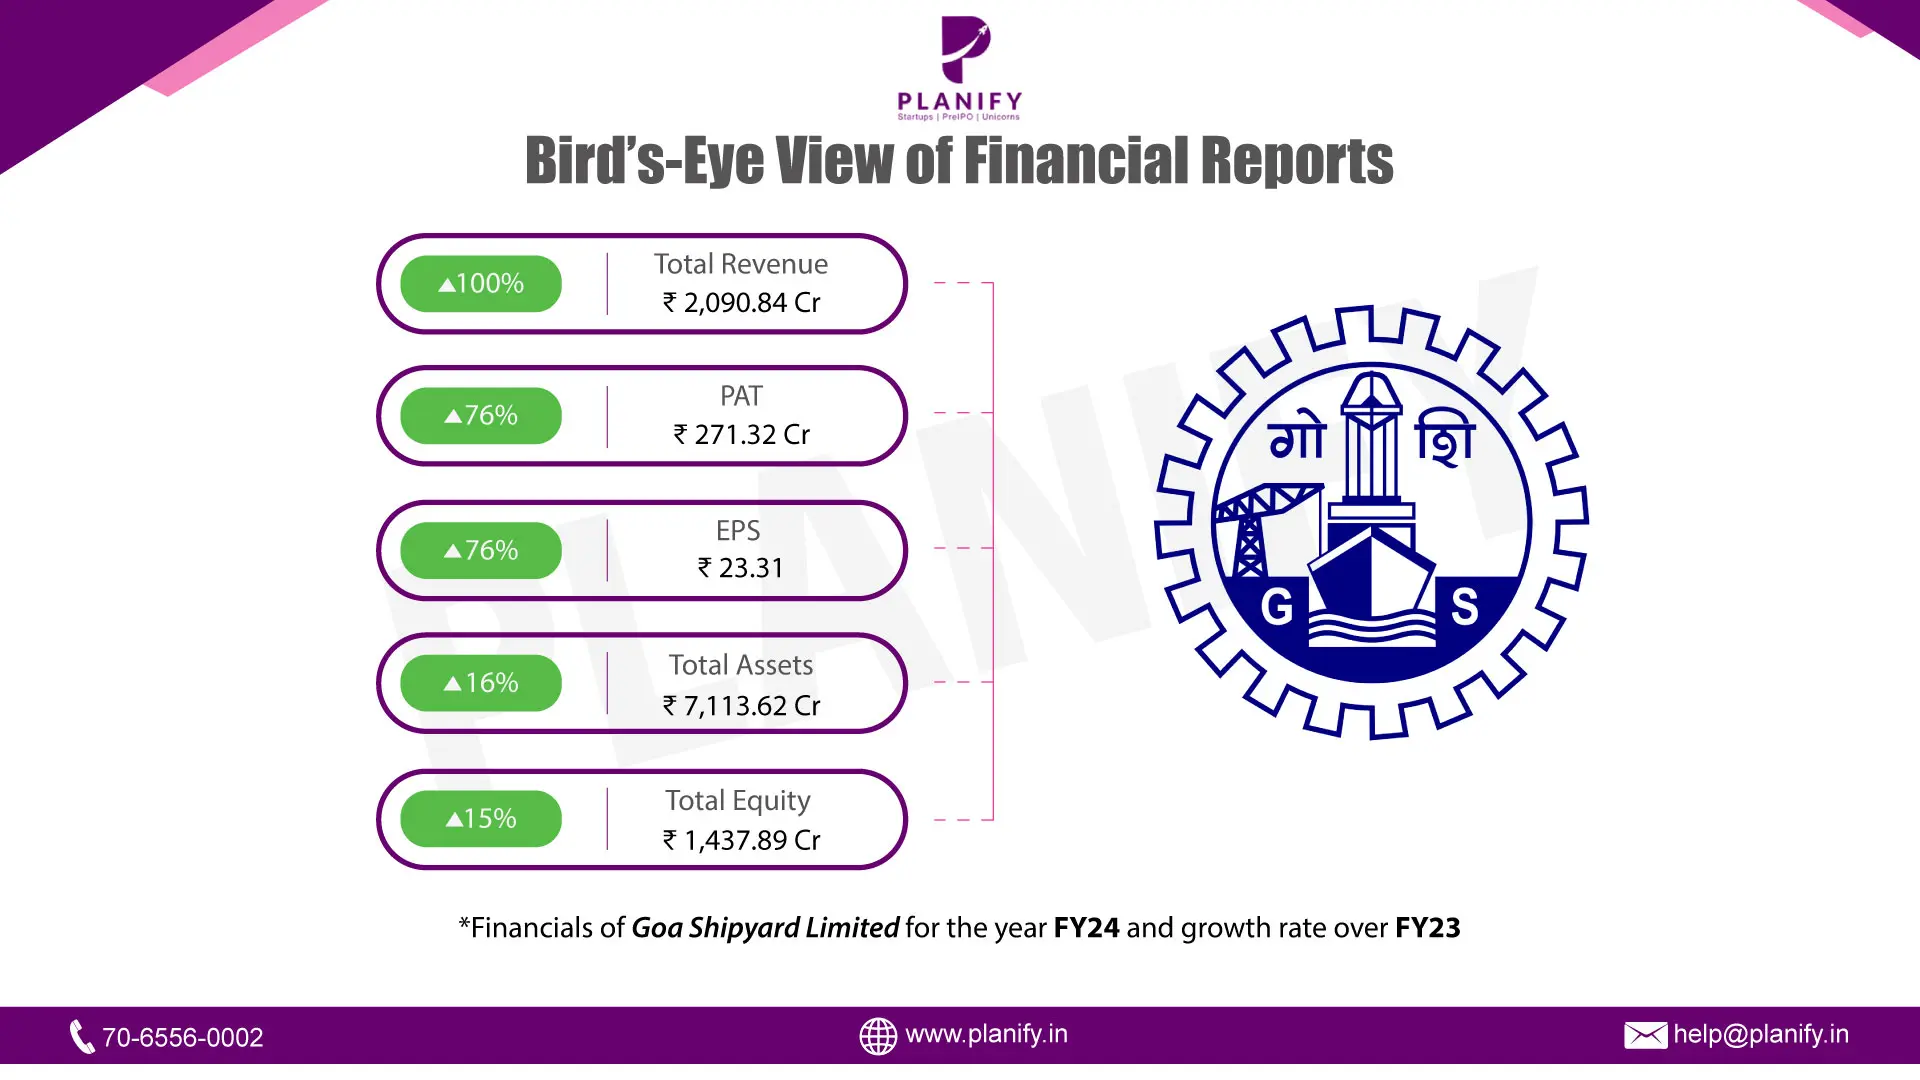
Goa Shipyard Limited has released its financials for FY24
Written by: Diksha Kalra
Published: Sep 16, 2026
Updated: Sep 16, 2026
3 min read
Goa Shipyard Limited has experienced exceptional growth in FY24, doubling its revenue and achieving a 76% rise in both PAT and EPS. The moderate increases in total assets and equity suggest the company has focused on leveraging its existing resources efficiently while maintaining profitability. Let's take a look at its performance:
1. Revenue & PAT: The company has doubled its revenue compared to the previous year, indicating a significant expansion in business operations or an increase in demand for its shipbuilding and defense services. With a 100% growth the company's revenue was reported at ₹2090.84 Cr. in FY24 as compared to ₹1045.80 Cr. in FY23. Similarly, PAT has grown by 76% from ₹154.54 Cr. in FY23 to ₹271.32 Cr. in FY24, suggesting that the company has managed to convert much of its increased revenue into profit.
2. Earnings Per Share: EPS has also increased by 76%, in line with the growth in PAT. The EPS was reported at ₹23.31 in FY24 compared to ₹13.28 in FY23 respectively. This is beneficial for shareholders, as it reflects the value generated per share. The significant increase in EPS suggests strong returns for investors.
3. Assets and Equity: The growth in total assets is modest (~ 16%) compared to the significant increase in revenue and profits. Total value of assets were reported at ₹7113.62 Cr. in FY24 as compared to ₹6131.18 Cr. in FY23 respectively. This suggests that the company has been able to generate higher returns without drastically increasing its asset base, showing effective asset utilization. On the other hand, the 15% increase in equity indicates that the company is strengthening its financial position, through retained earnings. Equity value of the company stood at ₹1437.89 Cr. in FY24 as compared to ₹1246.86 Cr. in FY23 respectively.
This overall strong performance positions the company well for future growth and shareholder value creation.
Stay Connected, Stay Informed –
Don’t miss out on exclusive updates, market trends, and real-time investment opportunities. Be the first to know about the latest unlisted stocks, IPO announcements, and curated Fact Sheets, delivered straight to your WhatsApp.


Planify Enterprises Private Limited
Planify Capital Limited
Licensed By




Mutual Fund License No.:
ARN-164419
IRDA Code (1):
ABLIC1003123454
IRDA Code (2):
ABLIC1003131639
Startup India Certificate No.:
DIPP93786
Other Websites


ⓒ 2016-2026 Planify. All rights reserved, Built with
in India


