



Marushika Technology IPO Analysis: Should You Buy or Skip?
Written by: Diksha Kalra
Published: Sep 16, 2026
Updated: Sep 16, 2026
14 min read
As India accelerates its digital infrastructure and government technology initiatives, Marushika Technology positions itself as a focused IT infrastructure and system integration provider catering to government, PSU, defence, and enterprise projects.
Let’s explore this upcoming IPO further:
Marushika Technology's share price will be finalised post-allotment, while grey market cues through the Marushika Technology's IPO GMP will likely reflect market sentiment closer to listing.
The Industry Backdrop: India’s IT Infrastructure Market
The IT infrastructure and telecom solutions industry underpins India’s digital transformation, driven by rising data consumption, cloud adoption, cybersecurity needs, and the expansion of smart and connected systems. Government initiatives like Digital India, smart cities, defence modernisation, and public digital infrastructure spending are accelerating demand for data centres, networking, surveillance, and integrated technology solutions across sectors.
However, the industry is execution-focused and competitive, particularly in the B2G segment, where projects are tender-driven and working capital-intensive. Success depends on technical capability, regulatory compliance, vendor relationships, and strong project management. Companies with proven government credentials and scalable execution capacity are better positioned to capture long-term growth opportunities in this structurally expanding sector
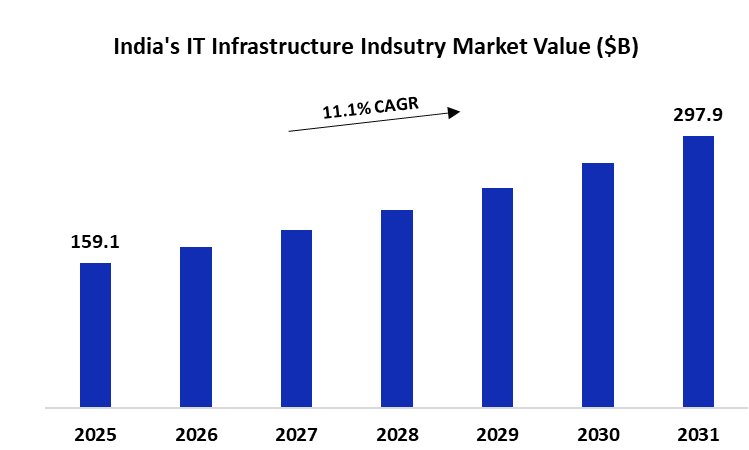
India's IT infrastructure industrial market size was valued at $159.1 B in 2025 and is projected to grow at a CAGR of 11.1% from 2026 to 2030.
The company operates in the IT infrastructure and system integration industry, which is benefiting from strong digital adoption and rising government technology spending. While the sector offers steady long-term growth, it remains execution-driven and competitive, making scale, project management, and financial discipline key success factors.
Powered by Froala Editor
Incorporated in 2010 and headquartered in Delhi, Marushika Technology Ltd operates in the IT infrastructure and system integration space, primarily catering to government departments and public sector undertakings. Over the years, it has positioned itself as a project-driven technology solutions provider rather than a pure product seller.
The company supplies and integrates products such as networking equipment, data centre infrastructure, surveillance systems, and telecom solutions. Instead of manufacturing hardware, it sources equipment from established OEMs and delivers end-to-end solutions — including installation, configuration, and project execution. Its business largely depends on government tenders, making execution capability and working capital management key to its operations.
Key products offered by the company
Networking & IT Infrastructure
Switches & Routers
Structured Cabling Systems
Network Security Appliances (Firewall, UTM)
Wireless Access Points
Data Centre Solutions
Servers & Storage Systems
Racks & Power Distribution Units (PDU)
UPS Systems
Data Centre Networking Equipment
As per 6M FY26, products related to IT & Data centre solutions comprise of 99% of the topline. The company generated around 95% of its revenue from private entities, while 56% of sales were made in the region of Delhi.
The company also provides products related to surveillance and security, and telecom & communications-related components. Apart from that, Marushika has a services segment which mainly includes installation, configuration, system integration, and project implementation of IT infrastructure products supplied to clients.
The company’s revenue is largely driven by the sale of traded goods, which has consistently contributed the majority share (around 78–87%) over the past few years. This shows the business is primarily hardware-led and procurement-based.
However, in 6MFY26, the service revenue share has increased to 41.28%, indicating a shift towards higher service contribution. If this trend sustains, it could improve margins and make the revenue mix more balanced going forward.
Powered by Froala Editor
The top line has given a high growth of around 51% CAGR from FY23 to FY25. While the growth in FY25 has been at 42%. However, the revenue jump as per 6MFY26 seems to be muted in terms of annualised growth. (As of Dec’25 Company currently has an order book of 35Cr).
Margins have improved moderately, with EBITDA margins expanding from to 6% in FY23 to 8.8% in FY25. The PAT margins have risen from 1.1% in Fy23 to 7.4% in Fy25. As per the management, an increase in higher margin projects & contracts from PSU client are some of the major reasons for the margin expansion.
The CFO, which was on the negative side in past years, has now been positive in Fy25 at 1Cr.
It must be noted that the company reports zero inventory in its financial statements primarily due to its specific procurement and delivery model. It can be observed that the company has maintained its debtor turnover ratio. The payable turnover ratio has increased, indicating favourable credit terms being received by the company.
Marushika Technologies has significantly reduced its debt level. D/E ratio has dropped from 2.6 in Fy23 to currently at 1.4 in Fy25.
ROE and ROCE stand at 53% and 27%, placing Marushika Technologies above the listed peers. The company has also maintained its current ratio well over the years, currently at 1.3.
Sector Specific Ratios
Receivables as a percentage of revenue have come down from over 65% to 47% in FY25, indicating better collection efficiency, though they still reflect the working capital-heavy nature of the business.
Cash flow performance has improved meaningfully, with CFO/PAT turning positive after being negative in earlier years, showing that profits are now translating into real cash.
At the same time, debt has reduced steadily from 2.6x to 1.02x, strengthening the balance sheet, while the current ratio remains stable but modest, highlighting the need for disciplined liquidity management.
Management + Promoter Holding
PAN HR Solution Limited’s promoters—Mr. Rajeev Kumar and Mrs Rajni Kumari—collectively bring nearly two decades of hands-on experience to the human resource and staffing services industry.
The promoters guide the company by implementing deep operational know-how in comprehensive manpower solutions, recruitment, and talent acquisition, with strong skills in managing large-scale nationwide workforce deployments and navigating the complex regulatory and competitive landscapes of the B2B staffing sector.
While 3 out of 6 board members are independent directors, the governance ensures quality as the audit and remuneration committees are led by independent directors.
From a control standpoint, the promoters hold a dominant 79.7% stake pre-issue. Post-IPO, this stake will dilute to 58.2%, but promoter influence will remain firmly intact, given their high base ownership and board control.
Powered by Froala Editor
The company will be using the proceeds for:
Debt repayment (₹500 lakhs): Repayment and/or prepayment of certain existing borrowings availed by the company. This will reduce financial costs, lower interest burden, and improve the debt-equity position, strengthening the balance sheet.
Working capital needs (₹1,468 lakhs): Funding day-to-day operational requirements such as procurement of IT and telecom infrastructure products, execution of ongoing government & PSU projects, managing receivables under B2G project cycles, and supporting expansion in defence auto-tech solutions and data centre infrastructure projects.
General corporate purposes (balance): Strategic initiatives, including business expansion, technology enhancements, strengthening execution capabilities, meeting corporate overheads, and other permitted expenditures within SEBI guidelines.
Overall, the issue aims to reduce leverage, strengthen working capital for project execution, and support growth in IT infrastructure, telecom solutions, surveillance systems, and defence-related technology services catering largely to government and PSU clients.
Peer Analysis (FY25)
Marushika Technology stands out in profitability metrics compared to its peers. Despite having moderate revenue (₹85 Cr), it delivers a strong ROE of 52.8% and ROCE of 26.9%, which are significantly higher than Vertexplus and Synoptics, and even better than Takyon on ROCE.
Its PAT margin of 7.4% is healthy for an infrastructure-focused, project-driven business. However, its D/E of 1.4 is notably higher than peers, indicating greater reliance on debt, which partly explains the strong return ratios but also adds financial risk.
On valuation, Marushika’s P/E of 15.9x and EV/EBITDA of 11.4x place it in a reasonable zone — much cheaper than Vertexplus (92.3x P/E) but slightly more expensive than Takyon and Synoptics on EV/EBITDA terms. Takyon appears stronger in revenue scale (₹99.4 Cr) with lower leverage, while Synoptics shows superior EBITDA margins (26.4%).
Overall, Marushika looks like a return-focused company with solid profitability but higher leverage, trading at mid-range valuations compared to peers.
Powered by Froala Editor
At Alpha Venture X Fund, we assess opportunities through our LMVT framework — Leadership, Moat, Valuation, and Tailwinds — enabling us to identify scalable businesses with durable fundamentals.
Leadership: Founder-led with strong industrial experience and equity retention, ensuring aligned execution and focus on scaling the IT & data centra infra business.
Moat: While the company has good relations with its OEMs and clients, the business lacks moats as the IT infra segment is led by various large players, and the company carries no patents as such.
Tailwinds: Rise in AI adoption and increase in IT infrastructure spending by the government.
Valuation: The company is valued at a fairrange, with P/E being at 15.9x; the EV/EBITDA ratio is also on the fair side, currently around 11.4x.
Bottom Line: Marushika Technologies lies in the growing industry. The company has high revenue growth but is based on the trading business, exposing it to supply chain vurerability. The valuation also lies in the fair range, making Marushika Technologies a selective, not an automatic buy.
Powered by Froala Editor
Stay Connected, Stay Informed –
Don’t miss out on exclusive updates, market trends, and real-time investment opportunities. Be the first to know about the latest unlisted stocks, IPO announcements, and curated Fact Sheets, delivered straight to your WhatsApp.


Planify Enterprises Private Limited
Planify Capital Limited
Licensed By




Mutual Fund License No.:
ARN-164419
IRDA Code (1):
ABLIC1003123454
IRDA Code (2):
ABLIC1003131639
Startup India Certificate No.:
DIPP93786
Other Websites


ⓒ 2016-2026 Planify. All rights reserved, Built with
in India


