


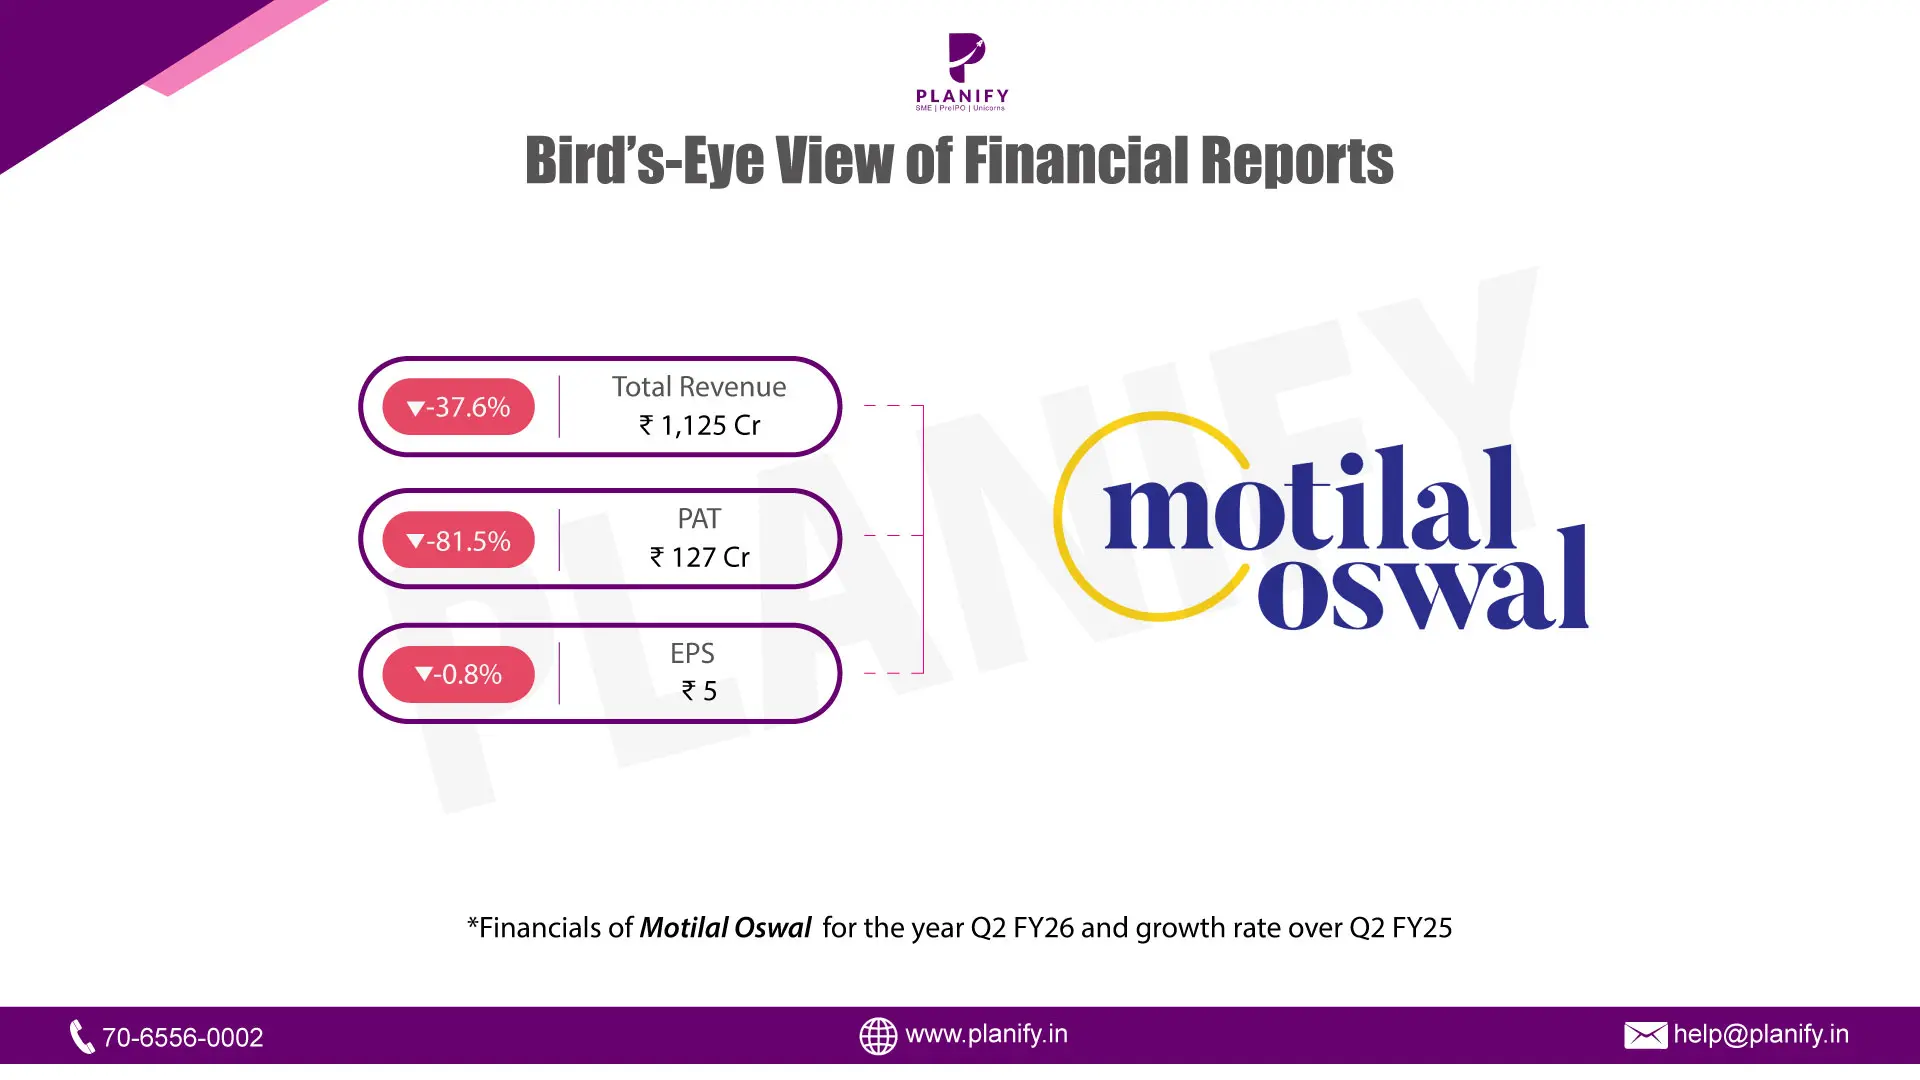
Motilal Oswal Financial Services Limited Q2 FY26 performance
Written by: Diksha Kalra
Published: Sep 16, 2026
Updated: Sep 16, 2026
3 min read
Financial Performance (Q2 FY26 vs Q2 FY25): Motilal Oswal Financial Services Limited reported a weaker financial performance in Q2 FY26, with total revenue declining by 37.6% year-on-year (YoY) to ₹1,125 crore, compared to ₹1,803 crore in Q2 FY25. The decline was mainly due to a sharp reduction in brokerage and fees income along with a loss on fair value changes of ₹40 crore, compared to a gain of ₹443 crore in the same quarter last year. Profit After Tax (PAT) declined by 81.5% YoY to ₹127 crore, compared to ₹689 crore in the same quarter last year.
Operational Metrics (Q2 FY26 vs Q2 FY25):Operational performance saw pressure on margins during the quarter due to the volatility in fair value gains and lower revenue. Operating margin declined to 22.5% in Q2 FY26 from 43.1% in Q2 FY25, while net profit margin reduced to 17.8% from 33.2% last year. The interest service coverage ratio stood at 2.78 times for the half-year ended September 2025, slightly lower than 2.92 times in the previous corresponding period. The debt-to-equity ratio improved to 1.15 times from 1.22 times, while the debtors turnover ratio slowed to 0.87 times from 1.04 times, indicating changes in collection velocity.
Strategic Developments: During the quarter, the company raised ₹500 crore via private placement of Non-Convertible Debentures (NCDs) to strengthen its liability profile. The company also allotted 9,98,550 equity shares under employee stock option schemes, continuing its focus on employee retention. A significant positive development was the upgrade of the company's long-term credit rating by ICRA to AA+ (Stable) from AA (Positive) in October 2025. The company’s net worth increased to ₹7,804 crore, up from ₹6,939 crore in the previous period. Additionally, the company voluntarily disclosed PAT excluding unrealized mark-to-market gains, which stood at ₹283 crore for the quarter, to provide a clearer view of underlying operating performance.
Stay Connected, Stay Informed –
Don’t miss out on exclusive updates, market trends, and real-time investment opportunities. Be the first to know about the latest unlisted stocks, IPO announcements, and curated Fact Sheets, delivered straight to your WhatsApp.


Planify Enterprises Private Limited
Planify Capital Limited
Licensed By




Mutual Fund License No.:
ARN-164419
IRDA Code (1):
ABLIC1003123454
IRDA Code (2):
ABLIC1003131639
Startup India Certificate No.:
DIPP93786
Other Websites


ⓒ 2016-2026 Planify. All rights reserved, Built with
in India


