


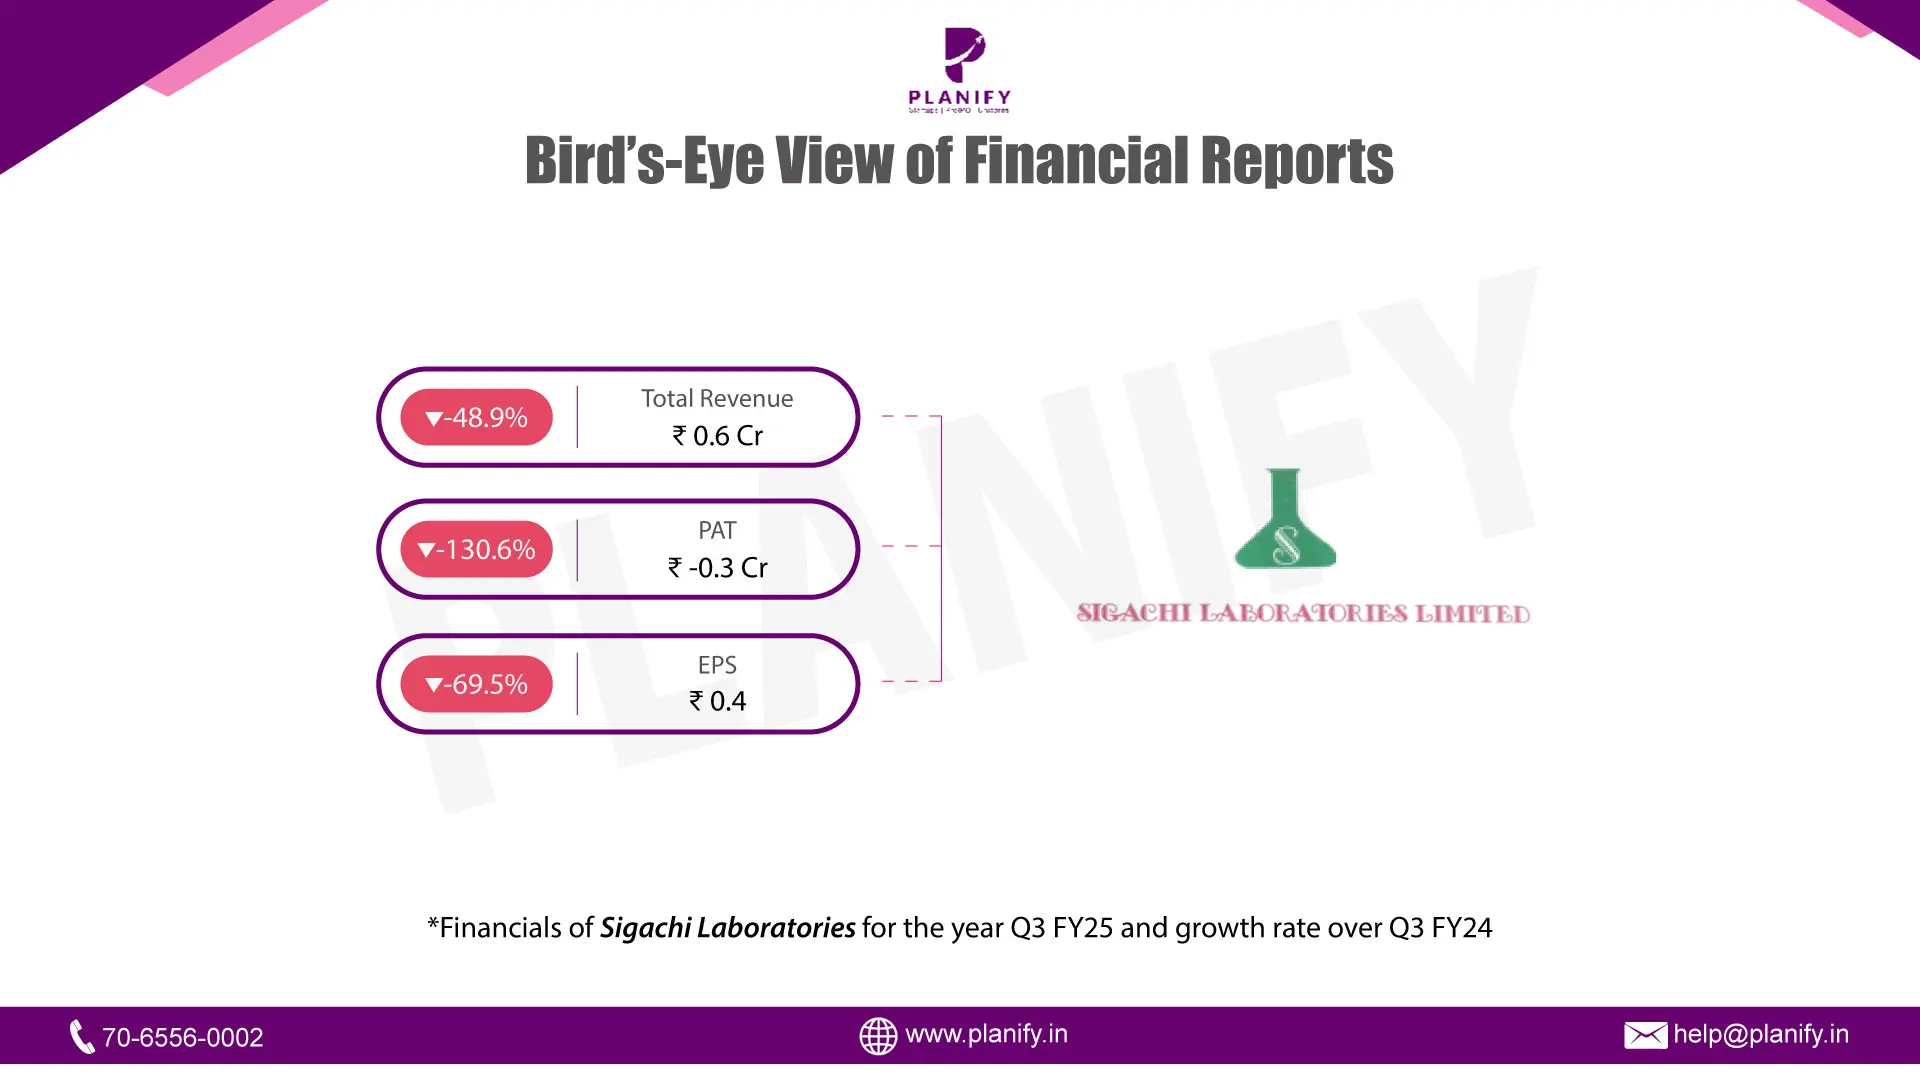
Sigachi Laboratories Q3 FY25 Earnings Update
Written by: Diksha Kalra
Published: Sep 16, 2026
Updated: Sep 16, 2026
3 min read
Financial Performance (Q3 FY25 vs Q3 FY24)
- Sigachi Laboratories reported total revenue of ₹0.6 Cr in Q3 FY25, reflecting a 48.9% year-on-year decline from ₹1.2 Cr in Q3 FY24. The drop was primarily due to lower investment income, which decreased significantly from ₹0.9 Cr in Q3 FY24 to ₹0.3 Cr in Q3 FY25.
- The Profit Before Tax (PBT) turned negative at ₹(0.2) Cr, compared to a profit of ₹1.1 Cr in Q3 FY24, impacted by a ₹0.6 Cr fair value loss. Similarly, Profit After Tax (PAT) declined to ₹(0.3) Cr from ₹0.9 Cr in Q3 FY24.
- Earnings Per Share (EPS) for the quarter stood at ₹(0.4), significantly lower than ₹1.3 in Q3 FY24.
Nine-Months Performance (9M FY25 vs 9M FY24)
- For 9M FY25, Sigachi Laboratories recorded total revenue of ₹3 Cr, declining 13.5% YoY from ₹3.4 Cr in 9M FY24.
- Despite revenue pressure, PBT increased 11.7% YoY to ₹2.4 Cr, compared to ₹2.1 Cr in 9M FY24, supported by cost efficiencies.
- PAT grew 26.1% YoY to ₹2.1 Cr, up from ₹1.7 Cr in 9M FY24, benefiting from lower tax outflows.
EPS for 9M FY25 Increased to ₹3.10, compared to ₹2.46 in 9M FY24.
Segment Performance (Q3 FY25 vs Q3 FY24)
1. Bulk Drugs & Intermediates (Lease Rents)
- Revenue: ₹0.35 Cr in Q3 FY25 vs ₹0.33 Cr in Q3 FY24 (4.5% YoY growth)
- Segment Profit Before Tax: ₹0.29 Cr in Q3 FY25 vs ₹0.28 Cr in Q3 FY24 (4.6% YoY growth)
- This segment exhibited stable revenue growth, benefiting from consistent lease rental income.
2. Investments
- Revenue: ₹0.28 Cr in Q3 FY25 vs ₹0.90 Cr in Q3 FY24 (68.8% YoY decline)
- Segment Profit Before Tax: Loss of ₹(0.32) Cr in Q3 FY25 vs Profit of ₹0.90 Cr in Q3 FY24
- The steep decline in investment income was the primary reason for the overall revenue and profit contraction.
Operational Metrics & Key Ratios (Q3 FY25 vs Q3 FY24)
- Employee costs rose 31.6% YoY to ₹0.1 Cr.
- Depreciation & Amortization grew 2.6% YoY to ₹0.06 Cr.
- Fair Value Loss: A ₹0.6 Cr one-time fair value loss impacted the bottom line significantly.
- Tax Expense: The total tax burden decreased to ₹0.09 Cr from ₹0.17 Cr in Q3 FY24 due to lower taxable profits.
Growth Outlook
- Sigachi Laboratories faced a challenging quarter, mainly due to investment-related losses that impacted profitability. However, the Bulk Drugs & Intermediates segment remained stable, ensuring some earnings stability.
- Moving forward, investment income volatility and cost management will be key focus areas. While lease rental income is consistent, the company must stabilize fair value fluctuations to avoid large profit swings.
Stay Connected, Stay Informed –
Don’t miss out on exclusive updates, market trends, and real-time investment opportunities. Be the first to know about the latest unlisted stocks, IPO announcements, and curated Fact Sheets, delivered straight to your WhatsApp.


Planify Enterprises Private Limited
Planify Capital Limited
Licensed By




Mutual Fund License No.:
ARN-164419
IRDA Code (1):
ABLIC1003123454
IRDA Code (2):
ABLIC1003131639
Startup India Certificate No.:
DIPP93786
Other Websites


ⓒ 2016-2026 Planify. All rights reserved, Built with
in India


