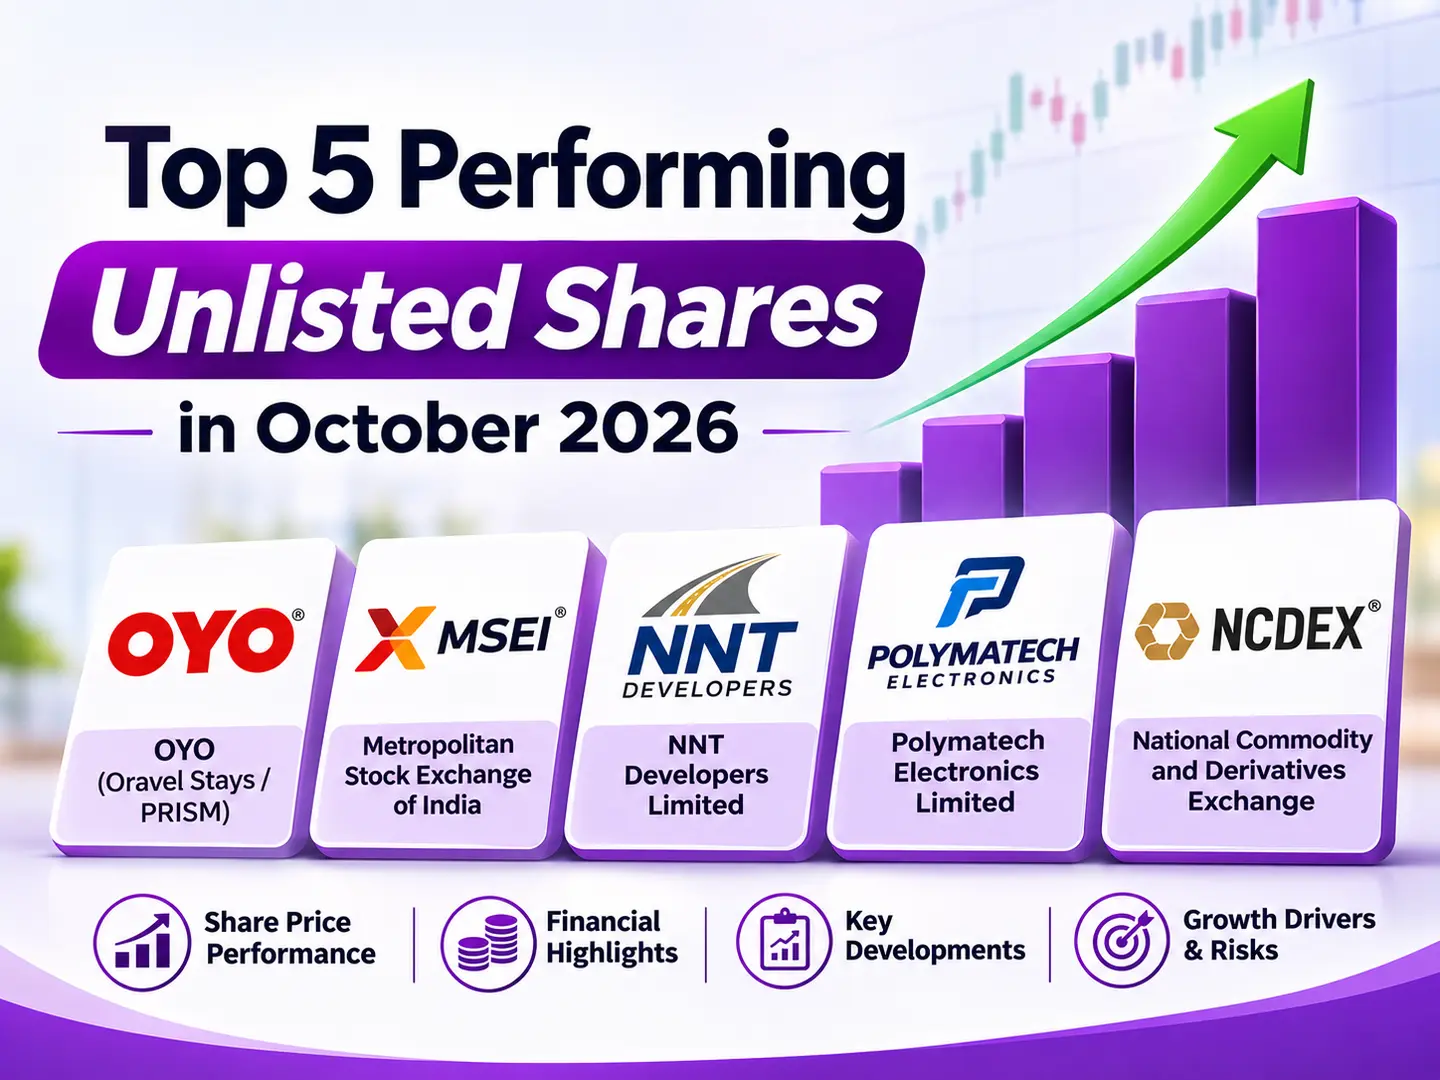
Top 5 Performing Unlisted Shares in October 2026

The unlisted share market in India has been gaining attention from investors seeking opportunities in companies across diverse sectors. Unlike listed stocks, unlisted shares are traded privately, with prices influenced by company performance, growth prospects, investor demand and expectations around future listings. This article highlights five unlisted companies that witnessed notable share-price performance in October 2026, examining their business operations, financial position and key developments to understand the factors influencing investor interest.
Which unlisted shares performed best in October 2026?
The top 5 performing unlisted shares in October 2026 were OYO (PRISM), Metropolitan Stock Exchange (MSEI), NNT Developers, Polymatech Electronics and NCDEX. The main triggers were IPO plans at PRISM and NNT Developers, a Moody’s outlook upgrade for PRISM, MSEI’s tokenised bond pilot and hopes of a trading recovery at NCDEX.
Top performing unlisted shares, October 2026
1. OYO (Oravel Stays / PRISM)
Sector: Hospitality and travel technology
Business model and revenue streams:
OYO follows an asset-light hospitality business model, connecting independent hotel owners and accommodation partners with travellers through its technology platform. Its business generates revenue through hotel bookings, franchise and management arrangements, vacation-home rentals and related hospitality services. Its international portfolio includes G6 Hospitality, which operates the Motel 6 and Studio 6 brands in North America. Its acquisition of G6 Hospitality strengthened its presence in the US market, while its European vacation-home business provides additional geographical diversification.
Revenue growth, EBITDA and profitability
Particulars | FY24 | FY25 | FY26 |
Total Income | 5,389.23 | 6,252.83 | 9,357.98 |
YoY Growth | - | 16.02% | 49.66% |
Gross Margin | 46.02% | 49.18% | 60.56% |
EBITDA | 727.18 | 1,114.46 | 2,557.93 |
Operating Margin | 13.49% | 17.82% | 27.33% |
PAT | 235.82 | -489.32 | 398.93 |
PAT Margin | 4.38% | -7.83% | 4.26% |
(Amount in Rs, Cr., except %)
Investor expectations in October 2026?
- Moody's Ratings revising PRISM's outlook from Stable to Positive on October 18, 2026, while reaffirming its B2 corporate family rating.
- PRISM's proposed IPO of approximately ₹6,650 crore, with a substantial portion intended for debt repayment.
Growth drivers | Risks |
Expansion in international hospitality markets | High debt and interest obligations |
Integration of G6 Hospitality | Competition from hotel chains and online travel platforms |
Improvement in EBITDA and cash generation | Dependence on hotel partners and service quality |
Reduction in debt through potential IPO proceeds | Execution and integration risks associated with acquisitions |
Growth in the vacation-home and premium accommodation businesses | Uncertainty regarding IPO timing and valuation |
2. Metropolitan Stock Exchange of India (MSEI)
Sector: Financial market infrastructure
Business model and revenue streams:
MSEI operates as a SEBI-recognised stock exchange providing electronic trading infrastructure across various financial market segments, including equity cash, equity derivatives, currency derivatives and debt securities.
Its revenue model is linked to transaction charges, exchange-related services, listing and market infrastructure activities, and other permitted services.
Revenue growth and profitability
Particulars | FY23 | FY24 | FY25 |
Total Income | 10.53 | 7.76 | 5.4 |
YoY Growth | - | -26.31% | -30.41% |
Gross Margin | 88.60% | 81.44% | 67.04% |
EBITDA | -45.92 | -47 | -41.47 |
Operating Margin | -436.09% | -605.67% | -767.96% |
PAT | -18.66 | -48.75 | -34.22 |
PAT Margin | -177.21% | -628.22% | -633.70% |
(Amount in Rs, Cr., except %)
Investor expectations in October 2026
- MSEI's investment proposition is linked to the potential expansion of India's capital markets and its ability to capture a larger share of exchange-related trading activity.
- Participation in a tokenised corporate bond issuance under SEBI's Demat 2.0 pilot, using blockchain-based distributed ledger technology. The first transaction involved IIFL Finance's ₹25 crore issue.
Key growth drivers and risks
Growth drivers | Risks |
Increasing participation in India's capital markets. | Strong competition from NSE and BSE. |
Addition of brokers and trading members. | Difficulty in attracting adequate trading volumes. |
Expansion of equity and derivatives trading | High technology and operating costs. |
Development of electronic bond trading infrastructure. | Continued operating losses. |
Technology-led financial market services | Dependence on capital infusion until operations become self-sustaining. |
3. NNT Developers Limited
Sector: Infrastructure and civil construction
Business model and revenue streams:
NNT Developers executes infrastructure and civil engineering projects for government departments, public-sector undertakings and institutional clients.
NNT Developers Limited is an infrastructure construction and EPC company, not primarily a real estate developer. Its September 30, 2026 DRHP describes its operations across roads, railways, river protection, buildings and water infrastructure.
Its major business verticals include:
• Road construction.
• Railway infrastructure.
• River protection and flood control.
• Building construction.
• Water supply and irrigation infrastructure.
• Agricultural market and tourism infrastructure.
The company primarily secures projects through tender-based bidding and generates revenue through execution of awarded contracts.
Revenue growth and profitability
Particulars | FY24 | FY25 | FY26 |
Total Income | 144.8 | 203.73 | 225.5 |
YoY Growth | - | 40.70% | 10.69% |
Gross Margin | 34.59% | 25.96% | 49.64% |
EBITDA | 17.94 | 33.03 | 34.77 |
Operating Margin | 12.39% | 16.21% | 15.42% |
PAT | 9.97 | 20.34 | 21.56 |
PAT Margin | 6.89% | 9.98% | 9.56% |
(Amount in Rs, Cr., except %)
Investor expectations in October 2026?
• The draft prospectus proposes a fresh issue of up to 1.72 crore equity shares. The proposed IPO and the company's infrastructure project portfolio may have increased investor interest in its unlisted shares
Growth drivers | Risks |
Government infrastructure spending. | High dependence on government contracts. |
New road, railway and water infrastructure projects. | Customer and geographical concentration. |
Expansion of the order book. | Increasing borrowings. |
Geographical diversification. | Negative operating cash flows. |
Potential improvement in project execution and cash conversion | Delayed receivable collection and high working capital requirements. |
4. Polymatech Electronics Limited
Sector: Electronics and semiconductor manufacturing
Business model and revenue streams:
Polymatech Electronics is an Indian electronics and semiconductor manufacturing company with operations centred on Chip-on-board (CoB) LED products and near-infrared medical instruments.
Its product portfolio includes:
• Chip-on-board LED engines.
• Ravaye Vein Finder medical instruments.
• Dental LED curing lights.
• Silicon-carbide power semiconductor products.
The company's wider international group also has exposure to printed circuit boards, semiconductor packaging, advanced electronics and international distribution. It operates through group entities in Singapore, Estonia, the US and UAE.
Revenue growth and profitability
Particulars | FY23 | FY24 | FY25 |
Total Income | 649.02 | 1,237.60 | 1,912.12 |
YoY Growth | - | 90.69% | 54.50% |
Gross Margin | 30.37% | 36.96% | 16.68% |
EBITDA | 185.42 | 320.23 | 496.29 |
Operating Margin | 28.57% | 25.88% | 25.95% |
PAT | 167.77 | 240.11 | 375.59 |
PAT Margin | 25.85% | 19.40% | 19.64% |
(Amount in Rs, Cr., except %)
Investor expectations in October 2026
- The broader semiconductor and electronics manufacturing industry remains an important investment theme because of increasing demand for electronic components, industrial applications and domestic manufacturing capabilities.
- Polymatech's diversified product portfolio and international group presence may influence investor expectations regarding future growth.
- Its November 12, 2026 shareholder communication is also worth reviewing for management's latest business outlook. However, because it was published after October, it should be treated as subsequent information rather than an explanation for October's price movement.
Key growth drivers and risks
Growth Drivers | Risks |
Increasing demand for semiconductor and electronic components. | High capital expenditure requirements. |
Expansion of domestic manufacturing. | Technology obsolescence. |
Diversification into medical and dental instruments. | Competition from established global players. |
Development of silicon-carbide power semiconductor products. | Customer concentration. |
International group operations and distribution network. | Execution risks associated with capacity expansion. |
5. National Commodity and Derivatives Exchange (NCDEX)
Sector: Commodity derivatives exchange
Business model and revenue streams: NCDEX operates as a technology-driven commodity derivatives exchange, providing an electronic marketplace for trading agricultural and other commodity derivatives.
Its business generates revenue through:
- Commodity exchange services.
- Transaction and trading charges.
- Clearing and settlement services.
- Electronic market services.
- Repository and related market infrastructure services.
The exchange plays an important role in facilitating transparent price discovery and risk management for farmers, traders, processors and other commodity-market participants.
Revenue and profitability
Particulars | FY24 | FY25 | FY26 |
Total Income | 108.71 | 96.47 | 114.25 |
YoY Growth | - | -11.26% | 18.43% |
EBITDA | -52.33 | -74.02 | -80.11 |
Operating Margin | -48% | -77% | -70% |
PAT | -27.5 | 236.05 | -46.27 |
PAT Margin | -25.30% | 244.69% | -40.50% |
Note: Total income = Revenue from operations + Other Income
(Amount in Rs, Cr., except %)
Regulatory developments
- A significant issue affecting NCDEX is the restriction on launching new contracts and taking fresh positions in certain major commodities, including Chana, Rapeseed-Mustard, Soybean and Refined Soy Oil.
- These restrictions have been extended until March 31, 2027, affecting transaction-related revenue. The company has specifically highlighted the resulting losses and negative operating cash flows in its financial disclosures.
Investor expectations in October 2026?
- Investors may be looking at NCDEX's potential recovery in commodity trading activity, expansion of its product portfolio and development of electronic market infrastructure.
- The gradual narrowing of consolidated losses and improvement in operating revenue in H1 FY27 may also be relevant to investor expectations.
- However, the regulatory restrictions on major commodities remain an important concern. The improvement in revenue must be assessed alongside the exchange's ability to return to sustainable profitability.
Key growth drivers and risks
Growth drivers | Risks |
Recovery in agricultural commodity derivatives trading. | Regulatory restrictions on commodity contracts. |
Introduction of new commodity contracts. | Continued operating losses. |
Growth in electronic agricultural markets. | Negative operating cash flows. |
Higher trading volumes and market participation. | Competition from other commodity exchanges. |
Expansion of clearing and repository services. | Dependence on trading volumes and market participation. |
Disclaimer: This article is for information and education only and is not investment advice or a recommendation to buy or sell any security. Unlisted share prices are indicative and past performance does not guarantee future returns. Unlisted shares carry high liquidity and valuation risk. Please consult a SEBI-registered investment adviser before investing.
Tags
Stay Connected, Stay Informed –
Don’t miss out on exclusive updates, market trends, and real-time investment opportunities. Be the first to know about the latest unlisted stocks, IPO announcements, and curated Fact Sheets, delivered straight to your WhatsApp.