


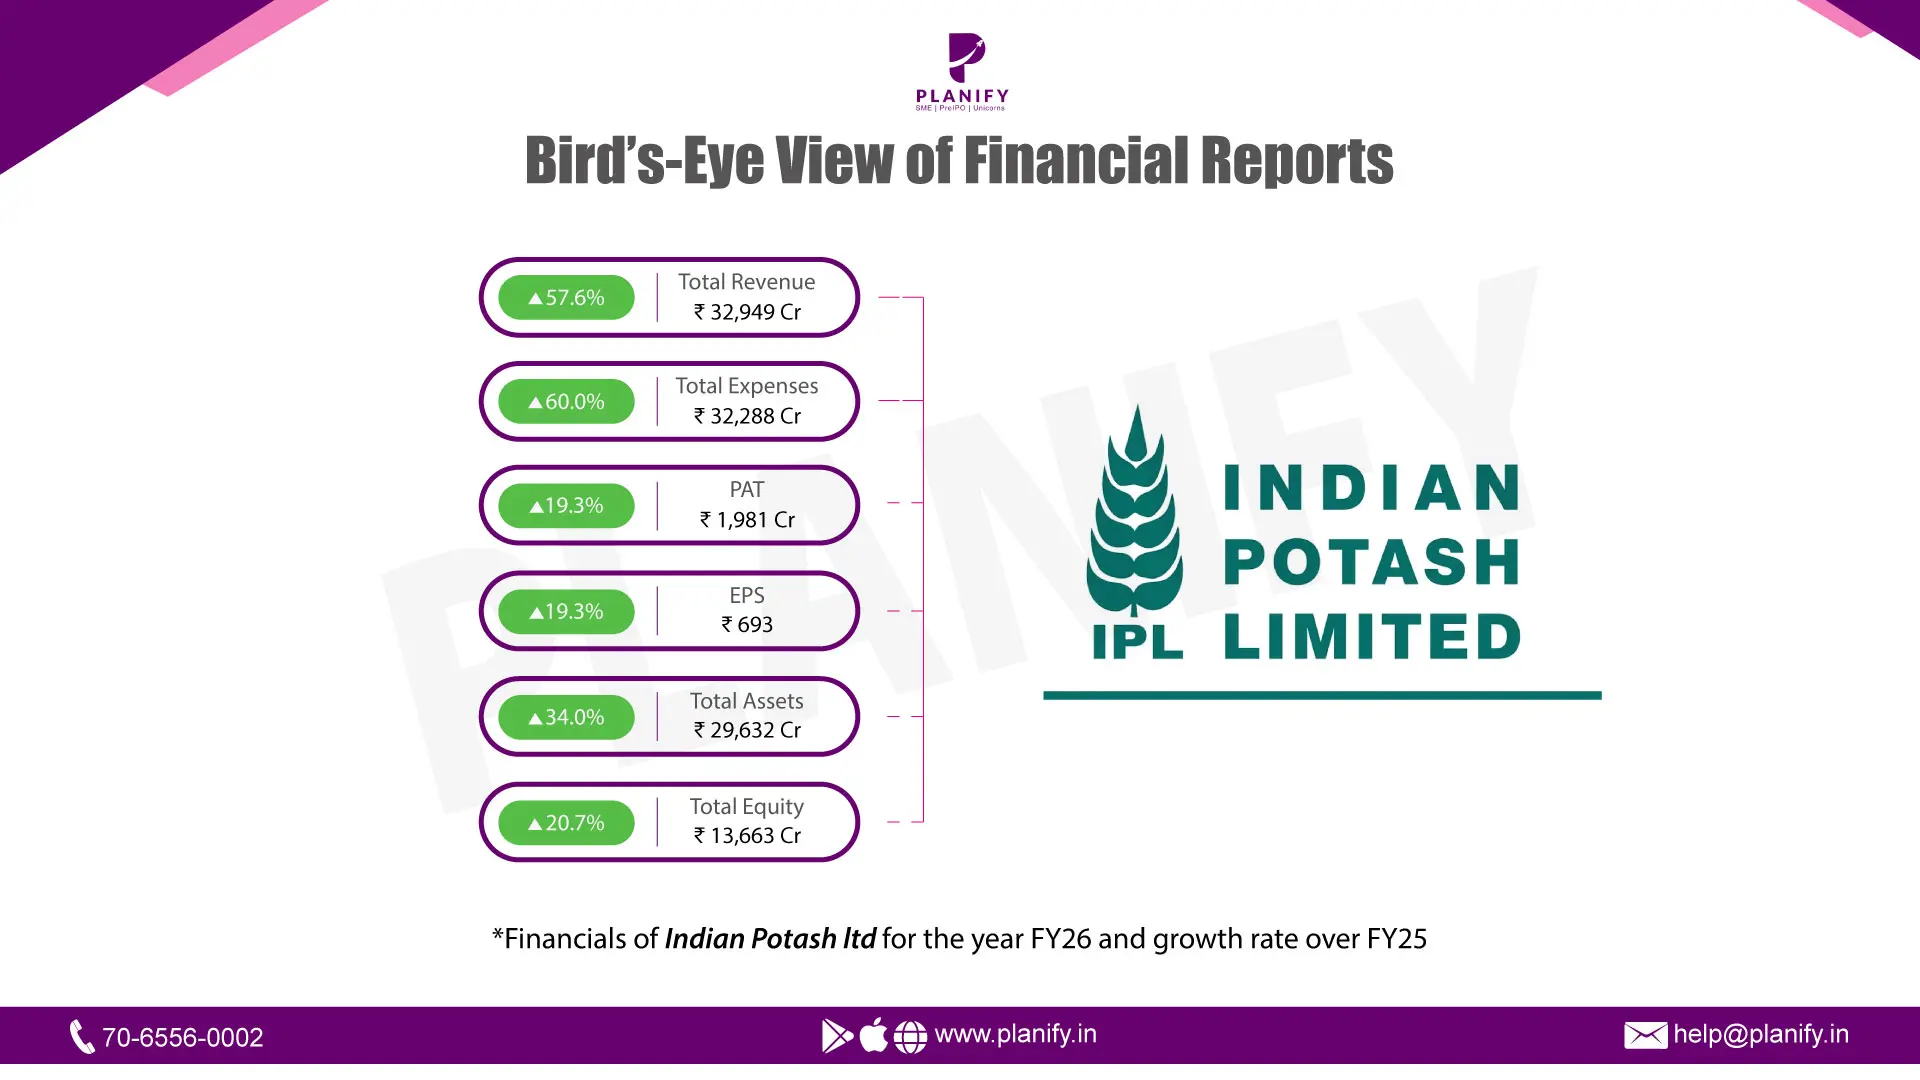
Indian Potash Limited- FY26 Results
Written by: Diksha Kalra
Published: Sep 16, 2026
Updated: Sep 16, 2026
5 min read
Indian Potash Limited (IPL)operates as one of India's largest fertiliser importers and distributors, with its core business centered on sourcing and marketing Muriate of Potash, Di-Ammonium Phosphate, Sulphate of Potash, and Urea across the country - including remote and inaccessible regions - through an extensive network of Regional offices covering nearly every State capital. Its distribution model leans heavily on India's agricultural cooperative structure and direct farmer engagement, backed by nationwide farmer education initiatives, product literacy campaigns, and sales outreach programs run in multiple regional languages. Beyond its fertiliser trading and distribution mandate, IPL has diversified into allied agri and consumer businesses, including manufacturing of Cattle feed products, Milk and milk products, Sulphitation and refined Sugar, Distillery operations, and trading in Gold and other precious metals - giving the company a multi-segment revenue base anchored around, but not limited to, its position in India's fertiliser supply chain. The Company, incorporated and headquartered in Chennai, Tamil Nadu, also plays a quasi-strategic role in the sector given its past mandate for global tender-based procurement of key fertilisers on behalf of the industry, reflecting close alignment with government food-security and farmer-welfare objectives.
1. Revenue, EBITDA, Net Profit & EPS Summary (Rs in Cr)
Particulars | FY26 | FY25 | YoY Change |
Revenue (Total Income) | 32,949 | 20,912 | 57.6% |
EBITDA | 1,964 | 1,305 | 50.5% |
EBITDA Margin | 0.06 | 0.06 | -0.3% |
Net Profit (NP) | 1,981 | 1,661 | 19.3% |
NP Margin (NPM) | 0.06 | 0.08 | -1.9% |
EPS (Basic & Diluted, Rs) | 693 | 581 | 19.3% |
Revenue surged ~57.6% YoY, driven largely by the trading (purchases of stock-in-trade) line rather than in-house manufacturing. Operating EBITDA grew more slowly at ~50.5%, and margin actually compressed slightly, as finance costs rose sharply alongside a much larger trading book. Consolidated net profit grew a more modest ~19.3%, diluting the consolidated margin even as absolute profit rose. EPS growth mirrors NP growth since the share count was unchanged.
2. Common-Size Statement
Particulars | FY25 (Rs Cr) | FY25 (% of Rev) | FY26 (Rs Cr) | FY26 (% of Rev) |
Revenue (Total Income) | 20,912 | 100% | 32,949 | 100% |
Cost of Materials Consumed | 1,414 | 7% | 1,872 | 6% |
Purchases of Stock-in-Trade | 16,855 | 81% | 25,246 | 77% |
Changes in Inventories (WIP, Stock-in-Trade & FG) | (851) | -4% | 875 | 3% |
Total Cost of Goods Sold | 17,418 | 83% | 27,992 | 85% |
Employee Benefit Expense | 132 | 1% | 146 | 0% |
Finance Costs | 499 | 2% | 1,177 | 4% |
Depreciation & Amortisation | 68 | 0.3% | 126 | 0.4% |
Other Expenses | 2,057 | 10% | 2,847 | 9% |
Total Expenses | 20,174.32 | 96% | 32,288 | 98% |
Cost of goods sold (materials consumed + trading purchases, net of inventory movement) rose from ~83.3% to ~85.0% of revenue - the trading business scaled with a slightly thinner gross spread, largely because the mix shifted further toward lower-margin purchases of stock-in-trade (fertiliser trading) versus in-house materials consumption. Finance costs jumped from ~2.4% to ~3.6% of revenue, reflecting the much larger working-capital borrowings needed to fund the bigger trading book. Employee costs and other expenses improved slightly as a share of revenue, showing some operating cost leverage even as gross margin narrowed.
3. Key Balance Sheet Items (Rs in Cr)
Particulars | FY26 (Rs Cr) | FY25 (Rs Cr) |
Property, Plant and Equipment | 1,859 | 1,542 |
Investments Accounted for Using Equity Method | 6,914 | 5,761 |
Inventories | 3,842 | 4,690 |
Trade Receivables | 8,246 | 4,507 |
Cash and Cash Equivalents | 2,644 | 367 |
Current Borrowings | 10,174 | 5,192 |
Non-Current Borrowings | 217 | 72 |
Trade Payables (Total) | 3,226 | 3,747 |
Total Equity | 13,663 | 11,321 |
4. Key Ratio Analysis
Ratio | FY26 | FY25 | YoY Change |
Net Profit Margin | 6.01% | 7.94% | - |
Return on Equity (ROE) | 14.50% | 14.67% | - |
Fixed Asset Turnover Ratio | 17.72x | 13.56x | +4.16x |
Debt-to-Equity Ratio | 0.76x | 0.46x | +0.30x |
Net Profit Margin fell as consolidated profit grew more slowly than revenue. ROE held roughly steady (~14.5-14.7%) as equity grew broadly in line with profit, aided by strong retained earnings. Fixed asset turnover jumped sharply (~13.6x to ~17.7x), reflecting that revenue growth was driven almost entirely by trading volumes rather than fresh capex on plant and equipment. The Debt-to-Equity ratio nearly doubled (0.46x to 0.76x), the clearest signal that the FY26 growth was financed substantially through incremental borrowings, consistent with the working capital.
Stay Connected, Stay Informed –
Don’t miss out on exclusive updates, market trends, and real-time investment opportunities. Be the first to know about the latest unlisted stocks, IPO announcements, and curated Fact Sheets, delivered straight to your WhatsApp.


Planify Enterprises Private Limited
Planify Capital Limited
Licensed By




Mutual Fund License No.:
ARN-164419
IRDA Code (1):
ABLIC1003123454
IRDA Code (2):
ABLIC1003131639
Startup India Certificate No.:
DIPP93786
Other Websites


ⓒ 2016-2026 Planify. All rights reserved, Built with
in India


