


NCL Buildtek Ltd posts weaker PAT despite higher revenue
Written by: Diksha Kalra
Published: Sep 16, 2026
Updated: Sep 16, 2026
3 min read
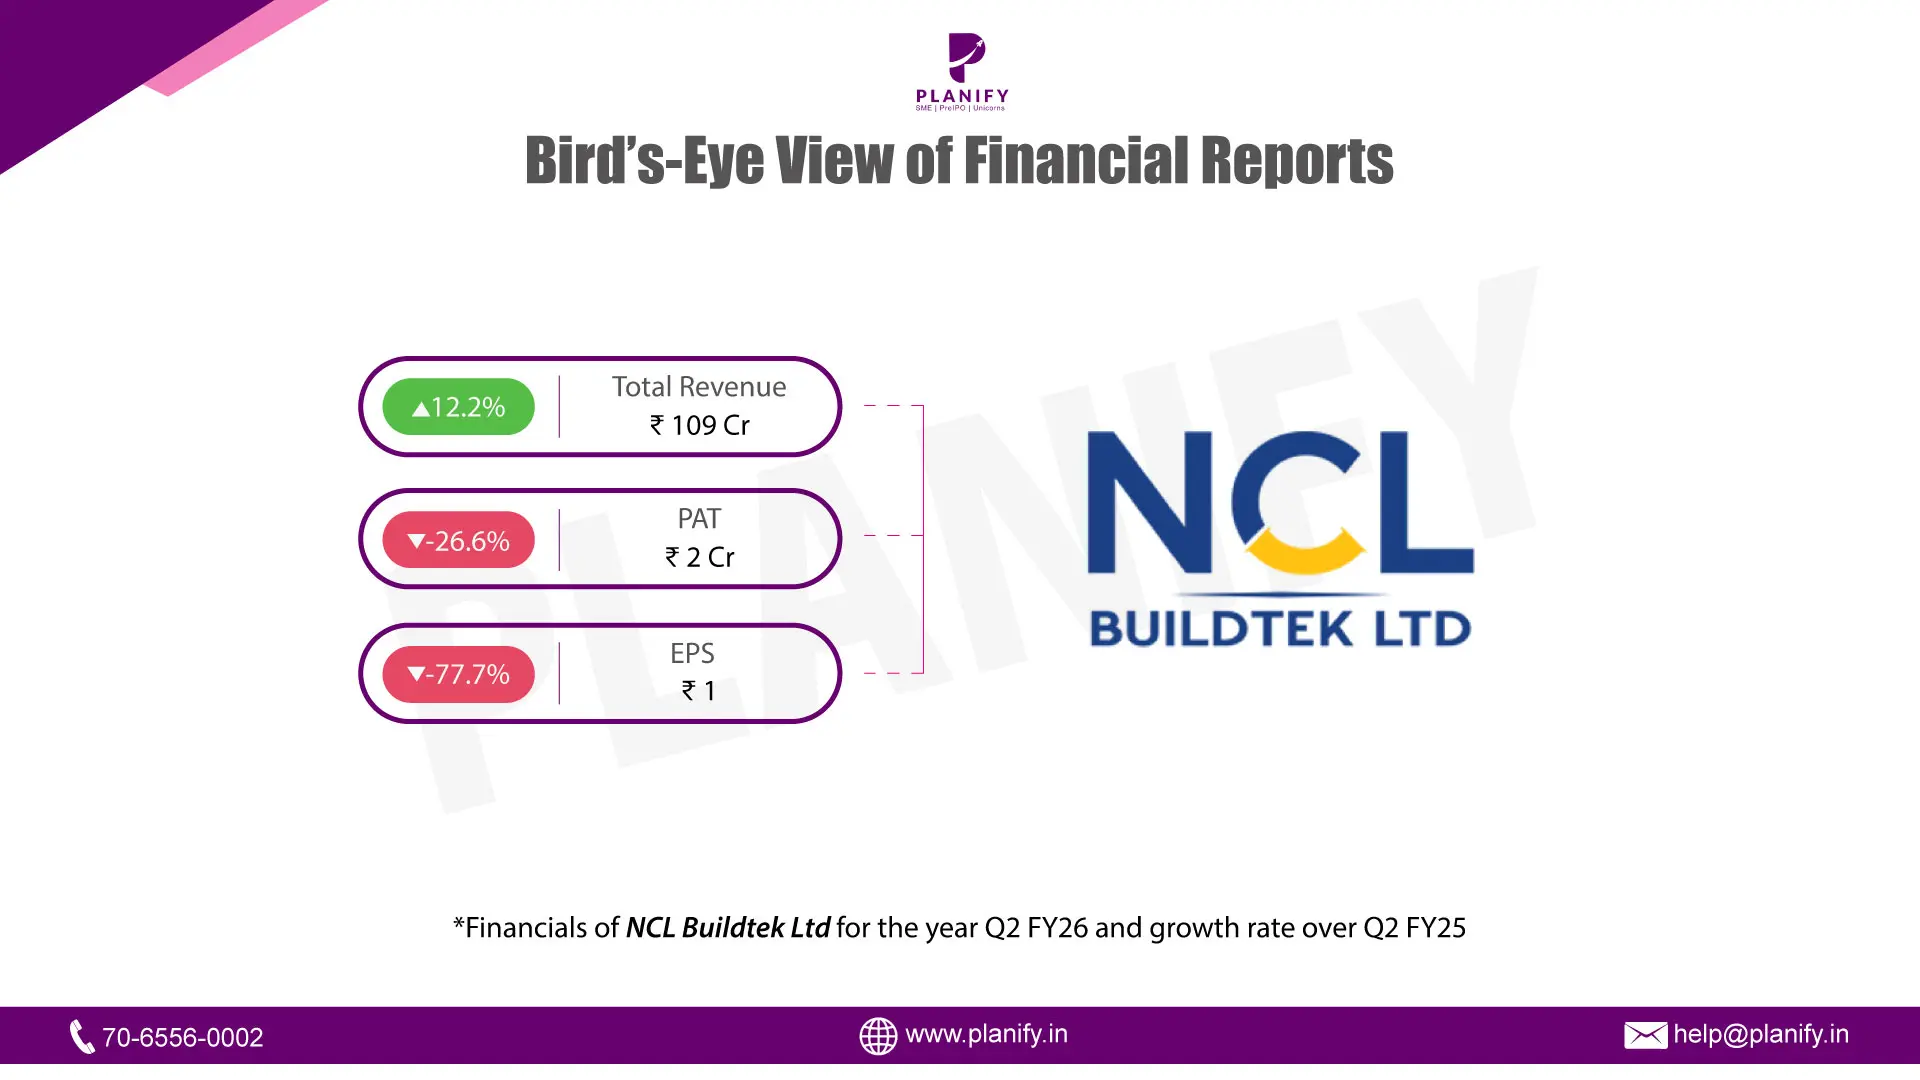
Financial Performance (Q2 FY26 vs Q2 FY25): NCL Buildtek Ltd reported a mixed set of numbers for Q2 FY26. Revenue from Operations (Consolidated) increased by 12.2% year-on-year (YoY) to ₹10,852.52 lakh, compared to ₹9,673.59 lakh in Q2 FY25. However, despite the growth in topline, Profit After Tax (PAT) declined by 26.6% YoY to ₹234.64 lakh, down from ₹319.51 lakh in the same quarter last year. This drop occurred even though Profit Before Tax (PBT) (after exceptional items) rose to ₹333.14 lakh from ₹194.81 lakh in Q2 FY25. The decline in PAT was primarily driven by a significant tax expense of ₹98.50 lakh in the current quarter, compared to a tax credit adjustment in the previous year. Consequently, Earnings Per Share (EPS) (including exceptional items) fell to ₹1.22 from ₹5.47 in the corresponding period last year.
Operational Metrics (Q2 FY26 vs Q2 FY25): Operational performance varied significantly across business segments. The Coatings segment posted strong growth, with revenue rising to ₹2,560.97 lakh from ₹2,188.84 lakh last year, and segment profit nearly doubling to ₹341.56 lakh. The Windoors segment remained the largest contributor, with revenue increasing to ₹5,867.59 lakh from ₹4,863.83 lakh. However, margins remained tight; the consolidated Operating Margin stood at 5%, while the Net Profit Margin was recorded at 2% for the quarter. The Interest Coverage Ratio was reported at 1.56 times, reflecting the impact of finance costs, while the Debtors Turnover Ratio stood at 1.88 times.
Strategic Developments: During the quarter, the company recorded an exceptional item gain of ₹79.99 lakh, which supported the profit before tax figures. While the Windoors and Coatings divisions showed resilience and growth, the Walls segment faced headwinds, reporting a segment loss of ₹84.08 lakh compared to a minor loss of ₹0.98 lakh in Q2 FY25. The company’s consolidated Net Worth stood at ₹23,060.09 lakh as of September 30, 2025, maintaining a stable capital base despite the pressure on bottom-line profitability. The financial results were reviewed by the Audit Committee and approved by the Board of Directors on November 13, 2025.
Stay Connected, Stay Informed –
Don’t miss out on exclusive updates, market trends, and real-time investment opportunities. Be the first to know about the latest unlisted stocks, IPO announcements, and curated Fact Sheets, delivered straight to your WhatsApp.


Planify Enterprises Private Limited
Planify Capital Limited
Licensed By




Mutual Fund License No.:
ARN-164419
IRDA Code (1):
ABLIC1003123454
IRDA Code (2):
ABLIC1003131639
Startup India Certificate No.:
DIPP93786
Other Websites


ⓒ 2016-2026 Planify. All rights reserved, Built with
in India


