


NSE Q1 FY27 vs Q1 FY26— What the Numbers Say? Core Profit Growth, One-Off Adjustments & the IPO Narrative
Written by: Diksha Kalra
Published: Sep 16, 2026
Updated: Sep 16, 2026
6 min read
NSE's June 2026 quarter results dropped on July 30, 2026, and there's a lot more texture here than "profit up 7%." Let's unpack it properly.
1. The headline numbers (Consolidated)
Metric | Q1 FY27 (Jun'26) | Q1 FY26 (Jun'25) | Change |
|---|---|---|---|
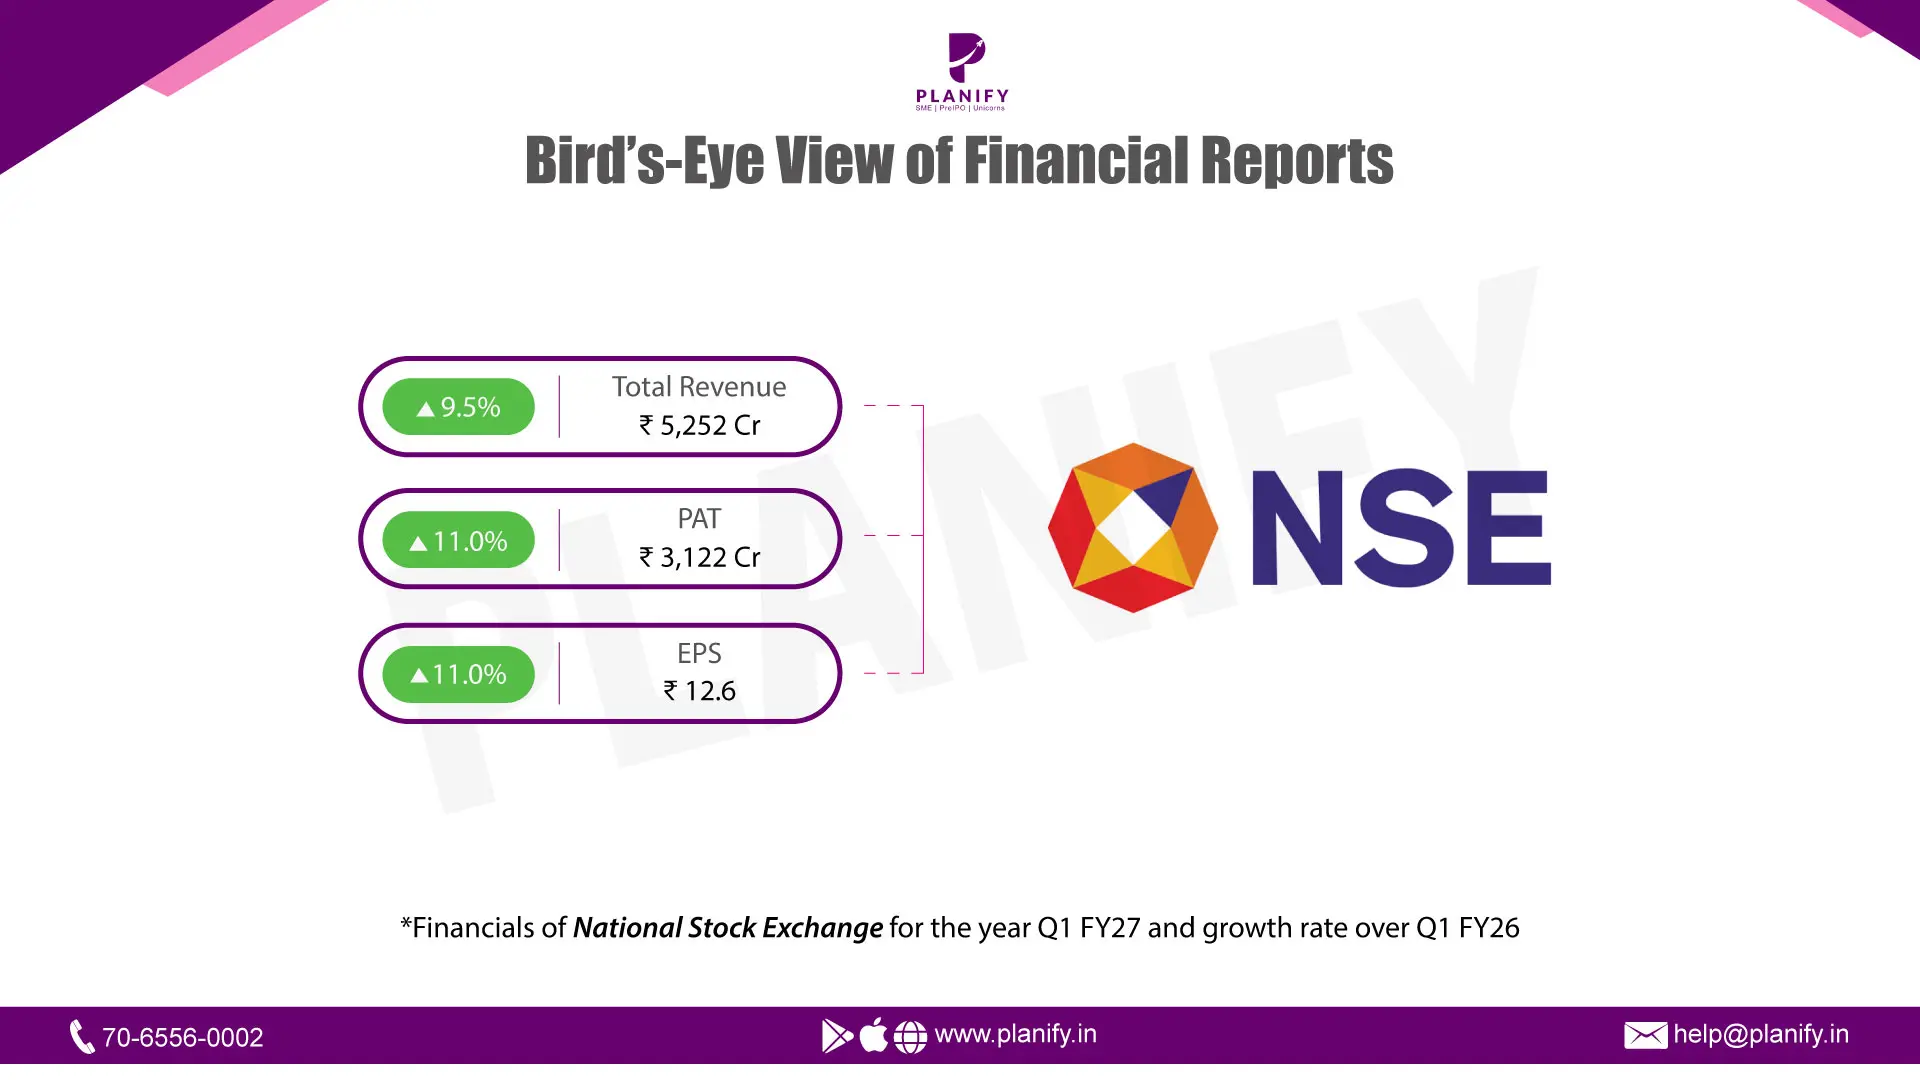
Revenue from operations | ₹4,560 cr | ₹4,032 cr | +13.1% |
Other income | ₹692 cr | ₹766 cr | -9.7% |
Total income | ₹5,252 cr | ₹4,798 cr | +9.5% |
Total expenses | ₹1,172 cr | ₹1,053 cr | +11.3% |
Profit before tax | ₹4,169 cr | ₹3,776 cr | +10.4% |
Net profit (total) | ₹3,120 cr | ₹2,924 cr | +6.7% |
EPS (basic & diluted) | ₹12.6 | ₹11.8 | +6.8% |
At first glance, a 6.7% profit growth on 13% revenue growth looks like margins are slipping. They're not — the gap is almost entirely a base-effect quirk, which is worth explaining in any write-up so readers don't draw the wrong conclusion.
2. Why "6.7%" is the wrong number to anchor on
Last year's Q1 (June 2025) carried a ₹112.04 crore one-off gain tucked into "discontinued operations" — proceeds from NSE's education-business subsidiary (NAL Academy) selling its stake in TalentSprint. That gain inflated the year-ago base.
Strip out discontinued operations and compare the core, continuing business:
- Q1 FY27 continuing-ops PAT: ₹3,122 cr
- Q1 FY26 continuing-ops PAT: ₹2,812 cr
- Real growth: 11%
That 11% is the number that actually reflects how the core exchange business performed. The 6.7% headline is just an artifact of comparing against a quarter that had an unusual boost baked in.
3. Where the revenue growth came from (segment-wise)
Segment | Q1 FY27 | Q1 FY26 | Growth |
|---|---|---|---|
Trading | ₹4,103 cr | ₹3,639 cr | +12.8% |
Clearing | ₹494 cr | ₹453 cr | +9.0% |
Others (data, indices, licensing) | ₹198 cr | ₹149 cr | +32.5% |
Trading is still the dominant engine — it's roughly 85% of segment revenue — but the "Others" bucket (data feeds, data terminals, index licensing) is the fastest grower by a wide margin, even if it's small in absolute terms. That's a bucket worth watching over the next few quarters since it's the more diversified, less market-volume-dependent part of NSE's business.
Segment profit tells a similar story — Trading segment result was ₹2,960 cr vs ₹2,599 cr, Clearing was ₹317.4 cr vs ₹303.4 cr, and Others jumped to ₹106 cr vs ₹71.1 cr (+49%), so profitability is actually growing faster than revenue in the smaller segments.
4. Cost side — expenses grew, but not alarmingly
Total expenses rose 11.3% YoY, slightly faster than total income (9.5%) but slower than core operating revenue (13.1%). The main movers:
- Employee benefits expense: ₹242.6 cr vs ₹197.6 cr (+22.8%) — the biggest percentage jump, partly tied to the new Labour Code transition (more on that below)
- Regulatory fees: ₹188.3 cr vs ₹169.9 cr (+10.9%)
- Depreciation: ₹162.5 cr vs ₹150.1 cr (+8.3%)
- Other expenses: ₹578.6 cr vs ₹535 cr (+8.1%)
Nothing here looks like a red flag — it's a business scaling its cost base roughly in line with growth, not overspending.
5. Two "exceptional items" worth knowing about
These sit below operating profit and are one-offs, so they don't reflect the ongoing business, but they explain some of the swing between PBT lines:
- Profit on sale of investment in associates: ₹20.3 cr gain — from partial stake sales in Indian Gas Exchange (IGX) by NSE Investments Ltd, done to meet shareholding-norm requirements, not a strategic exit
- Impact of new Labour Code: ₹48.3 cr reversal of provision (a gain) — this relates to gratuity accounting changes under India's new labour codes that kicked in this year
Together these added about ₹68.6 cr to pre-tax profit, on top of the operating performance.
6. The SEBI settlement — the real story behind the story
NSE's board approved paying ₹714.7 crore to close out the Colocation and Dark Fibre cases with SEBI — disputes that have been running since 2019, through SEBI's Whole-Time Member orders, Adjudicating Officer orders, SAT appeals, and Supreme Court proceedings. The total settlement is ₹1,491.2 crore, of which NSE had already deposited ₹776.5 crore earlier; this payment closes the gap.
Why this matters for anything investor-facing: NSE had already provisioned ₹1,391.2 crore for this in FY26, so the P&L hit isn't sitting in this quarter — the cash settlement is largely pre-funded. What it does do is remove a near-decade-old regulatory overhang right as NSE moves toward its IPO, which is likely to matter more to unlisted-market sentiment than the quarter's actual profit number.
7. Standalone vs Consolidated — the associate/subsidiary gap
- Standalone PAT: ₹2,634.8 cr vs ₹2,408.61 cr (+9.4%)
- Consolidated PAT: ₹3,120.08 cr vs ₹2,923.85 cr (+6.7%)
The ~₹485 crore gap between standalone and consolidated comes from subsidiaries (NSE Clearing, NSE Indices, NSE Data & Analytics, etc.) and NSE's share of profit from associates like NSDL — a reminder that a meaningful chunk of NSE's overall earnings power sits outside the parent entity, in the ecosystem it has built around itself.
Stay Connected, Stay Informed –
Don’t miss out on exclusive updates, market trends, and real-time investment opportunities. Be the first to know about the latest unlisted stocks, IPO announcements, and curated Fact Sheets, delivered straight to your WhatsApp.


Planify Enterprises Private Limited
Planify Capital Limited
Licensed By




Mutual Fund License No.:
ARN-164419
IRDA Code (1):
ABLIC1003123454
IRDA Code (2):
ABLIC1003131639
Startup India Certificate No.:
DIPP93786
Other Websites


ⓒ 2016-2026 Planify. All rights reserved, Built with
in India


