


NSE - Still an investable opportunity? NSE V/s BSE Face-off
Written by: Diksha Kalra
Published: Sep 16, 2026
Updated: Sep 16, 2026
3 min read
BSE, founded in 1875, held the crown as Asia’s oldest exchange, rich in legacy and deeply trusted by generations of investors. For over a century, it ruled the Indian markets, setting benchmarks and shaping the contours of Indian finance.
But the winds began to shift in the early 2000s. NSE, born in 1992 with a technology-first approach, saw an opportunity to redefine the game. It introduced electronic trading, real-time price dissemination, and lower transaction costs, capturing the imagination of retail and institutional investors alike.
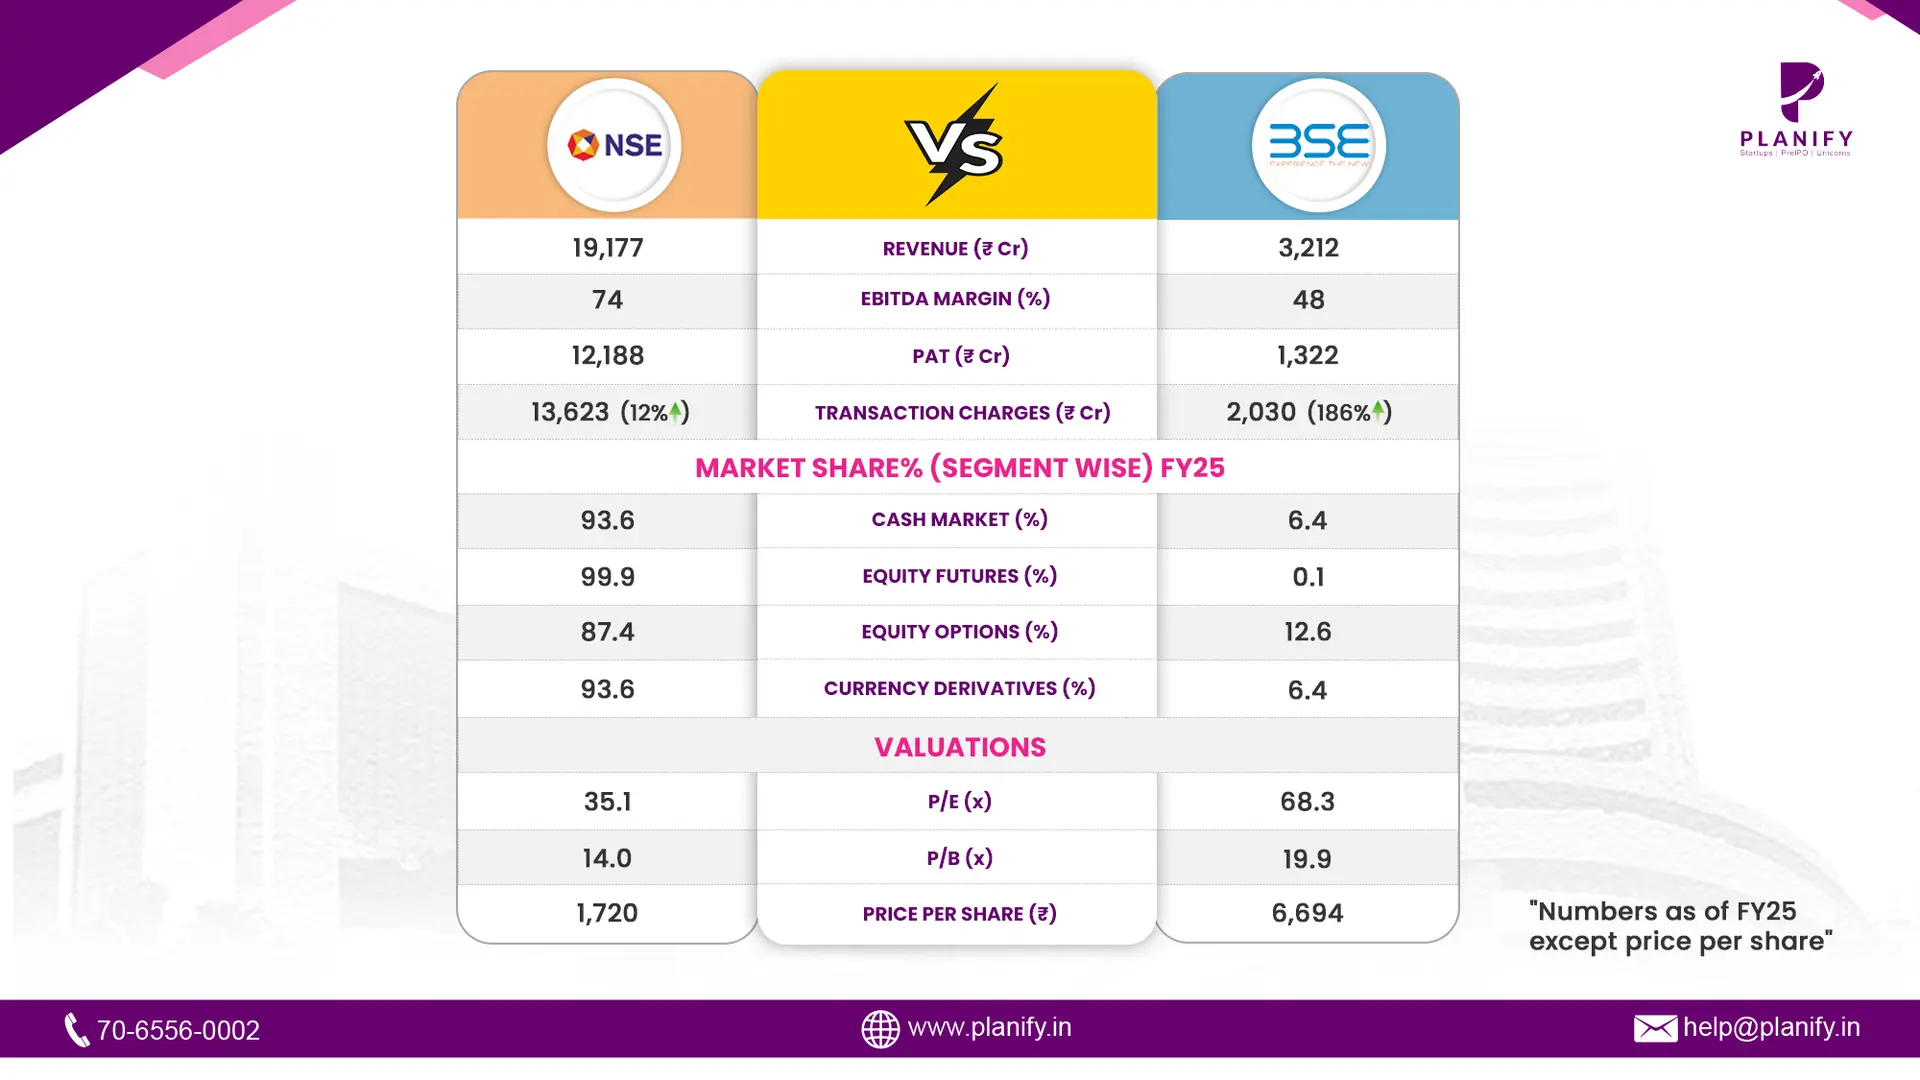
Over the last 2 years, this transformation has become starkly visible. NSE's equity and derivatives trading dominance became nearly absolute, with a 99.8% share in equity derivatives and over 94% share in the cash market. It was leading and setting global standards, ranking as the world’s largest derivatives exchange by contracts. An investment in NSE, through unlisted shares or proxies like exchange-traded products, would have yielded exceptional returns, driven by a 47% jump in FY25 PAT, a stellar ROE of 45%, and a consistent EBITDA margin of 74%, showcasing capital efficiency rarely seen in Indian financials.
Metrics (Rs Cr) | FY23 | FY24 | FY25 |
Total Income | 12,765 | 16,765 | 19,177 |
EBITDA | 9,428 | 9,870 | 12,647 |
Profit After Tax | 7,356 | 8,306 | 12,188 |
However, some reasons why investors need to be cautious:
- IPO timeline has been pushed further as the SEBI highlighted certain gaps in the latest letter filed by the NSE for the issuance of NOC.
- The shareholding pattern as of 31st March 2025 shows an overall increase in the Public holdings by 7.8% major increase in holdings by AIFs(5.11%), and Resident Individuals(5.87%), and a sell-off by Non-public FDIs and FPIs worth 6% and 5% respectively, which indicates a shift towards increased public holdings.
- NSE's Q4 FY25 results show a sequential decline compared to Q3 FY25 in key trading metrics and associated revenue. Average Daily Volumes (ADVs) in the Cash Market declined by 8% Q-o-Q, Equity Futures ADTV declined by 6% Q-o-Q, and Equity Options (Premium Value) ADTV declined by 17% Q-o-Q in Q4 FY25. This led to a sequential decline in Transaction Charges (down 15% Q-o-Q) compared to BSE’s, transaction charges up by ~20% Q-o-Q.
Stay Connected, Stay Informed –
Don’t miss out on exclusive updates, market trends, and real-time investment opportunities. Be the first to know about the latest unlisted stocks, IPO announcements, and curated Fact Sheets, delivered straight to your WhatsApp.


Planify Enterprises Private Limited
Planify Capital Limited
Licensed By




Mutual Fund License No.:
ARN-164419
IRDA Code (1):
ABLIC1003123454
IRDA Code (2):
ABLIC1003131639
Startup India Certificate No.:
DIPP93786
Other Websites


ⓒ 2016-2026 Planify. All rights reserved, Built with
in India


