NSE’s F&O Engine Hits a Speed Breaker — But the Monopoly Still Drives the Market


Key Adjusted Numbers & Interpretation
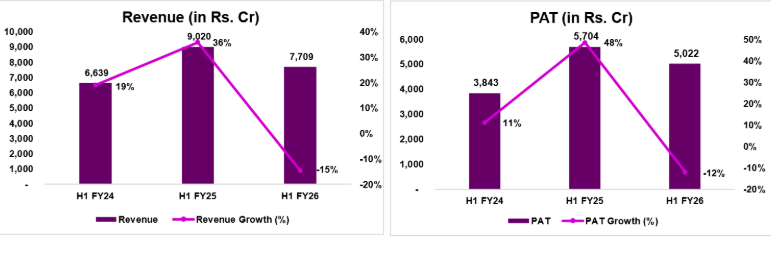
For H1 FY26, NSE reported revenue of ~₹7,709 crore (down ~15% YoY).
Reported PAT was ~₹5,022 crore (down ~12% YoY), including two large one-off items.
The hidden line items:
A charge of ₹1,297 crore for a pending settlement with the Securities and Exchange Board of India (SEBI) on legacy colocation/dark-fibre matters.
A gain of ₹1,201 crore from the sale of its stake in NSDL (India) Ltd..
On a normalised basis (excluding those two items), core PAT is estimated at ~₹5,092 crore (down ~11% YoY).
Transaction charges—a key revenue component—fell ~18% to ~₹5,935 crore.
Interpretation:
While headline results soften moderately (~12% PAT drop), the deeper indicator of core business strength shows a larger (~11%) decline, indicating real operational pressures — not just accounting noise. The business remains structurally strong, but one-time items mask the underlying slide in volume-driven income.
2. What is Driving the Downturn? The Regulatory Impact
As of now, we have placed a heavy emphasis on regulatory reforms instituted by SEBI aimed at speculative F&O (Futures & Options) trading. Key drivers:
Volume declines across major segments:
Cash market down ~26% YoY
Equity futures down ~30%
Equity options down ~29%
Currency derivatives down ~26%
These declines stem from SEBI interventions:
Larger contract sizes
Fewer expiries (weekly options reduced)
Higher margin and upfront collection requirements
Tighter position limits
Because the F&O business was a major growth engine for NSE, these regulatory shifts bite directly into its top-line: in history, we have seen that growth in the F&O segment was a primary reason NSE’s revenue had soared historically.
Deeper commentary:
NSE has long benefited from “flow trading” and short-duration derivative churn (especially weekly options), which generate very high transaction charges. The regulatory clamp-down essentially limits that engine.
Thus the decline in volumes is not merely cyclical but represents structural change in trading behaviour: less speculative, more considered.
NSE’s transaction-fee model is highly volume-sensitive, with transaction charges accounting for ~77% of revenue in the H1 analysis.In short, the business is being required to transition from a high-frequency turnover model to a more stable, but lower-velocity model of trading and revenue.
3. Margin & Cost Response
Despite the revenue and volume pressure, NSE’s operating margin(normalised) improved to ~77% (from ~72% last year).
Key factors:
Costs fell ~26% (excluding the settlement provisioning), driven by: lower regulatory/clearing fee burdens (linked to lower volumes) and cost discipline.
The ratio of high-fixed-cost components (tech-infrastructure investments made years ago) means the decline in volume has not hurt margins proportionally — a sign of operational leverage.
Takeaway: While revenue is falling, NSE is defending its profitability quite well, which enhances its profile as a high-quality franchise. This suggests that even if volumes stabilise at a lower level, the business can remain very profitable.
4. Outlook & Future Business Impact
Short-term (next 6–12 months):
Expect continued pressure in F&O volumes given regulatory headwinds and the baseline now being lower.
Visibility is weak: Near-term earnings growth is uncertain. Key catalyst: resolution of SEBI settlement matter — until clarity arrives, uncertainty persists.
Medium-term (12–24 months):
Volumes are likely to settle at a “new normal” lower than prior peaks, and growth will shift from speculative turnover to deeper investor-base growth, product diversification (data, index licensing, listings) and new geographies. For example: Data centre revenue +11%, listing services +13%. These are structural revenue streams.
It has been noticed that it sees growth coming from expansion of investor participation (24 crore accounts), IPO pipeline (122 IPOs in H1) and overall capital markets growth.
Long-term (>3 years):
Structural tailwinds remain strong: household financial savings moving into capital markets, digital broking, passive investing, and increasing depth of Indian markets.
NSE’s “monopoly” / dominant market share remains intact (cash market ~92.3%, equity futures ~99.8%, currency derivatives 100%).
With such dominance, when volumes eventually recover (or stabilise), the franchise value remains intact.
Net impact:
The business is in transition. Revenue and volume are down, but profitability remains strong. The structural story remains intact. Long-term investors likely will find this attractive, but short-term downside risk remains.
5. Valuation Implications & Unlisted Share Market Context
The current estimates normalized EPS for H1 FY26 at ~₹20.60 (annualised ~₹41-42) and suggests current NSE unlisted share price ~₹2080 implies a P/E ~47.5x.
In other words, the market is pricing in a return to higher volume growth, favourable regulatory resolution, IPO clarity and structural growth.
Our verdict: For existing unlisted shareholders, it’s a “hold”. For new entrants, there’s caution: waiting for volume stabilisation, regulatory clarity and some margin of safety is prudent.
Key risks remain: permanent lower F&O volumes, regulatory shock, and delay in IPO/settlement.
6. Additional Considerations Not Covered (or Under-Explored)
Settlement risk & timing: The exact outcome of SEBI’s settlement and any extra regulatory/penalty risk remains unclear — this could present upside or downside depending on how it resolves.
Product mix and diversification: While data and index/licensing are mentioned, how fast they can scale to offset retained F&O‐revenue losses is uncertain.
Competitive/regulatory risk: There is mention of possible competitive consequences if regulatory frameworks favour alternate exchanges (e.g., Bombay Stock Exchange) or other platforms, though current dominance remains.
Macro/market cycle risk: If capital markets activity in India slows (e.g., fewer IPOs, lower investor participation), the tailwinds may soften.
Unlisted share liquidity & risk: The current situation reminds us that unlisted shares carry an illiquidity premium, limited price discovery and higher risk — if public listing is delayed or terms unfavourable, value realisation could be delayed.
7. Enhanced Summary Verdict
Strengths: Exceptional business model with near-monopoly market share, very high margins, cost discipline, and structural growth tailwinds.
Weaknesses/Headwinds: Massive dependence on F&O volumes, which are in structural decline due to regulatory change; near-term earnings visibility is weak; settlement/regulatory overhang is unresolved.
Risk/Reward for investors:
If you have a long-term horizon (3-5 years+), are comfortable with some earnings softness now, believe in the India capital markets growth story, this looks like a compelling infrastructure stake.
If you're looking for near-term returns or a high margin of safety, you might prefer to wait for signals: a few quarters of stabilised volumes, regulatory clarity, IPO timeline and some valuation correction.
Tags
Stay Connected, Stay Informed –
Don’t miss out on exclusive updates, market trends, and real-time investment opportunities. Be the first to know about the latest unlisted stocks, IPO announcements, and curated Fact Sheets, delivered straight to your WhatsApp.


Planify Enterprises Private Limited
Planify Capital Limited
Licensed By




Registrations & Certifications
Mutual Fund License No.:
ARN-164419
IRDA Code (1):
ABLIC1003123454
IRDA Code (2):
ABLIC1003131639
Startup India Certificate No.:
DIPP93786
Other Websites
Address
MiQB, Plot 23, Sector 18 Maruti, Industrial Development Area, near Motherson Sumi Systems Limited, Gurugram, Haryana 122015


ⓒ 2016-2026 Planify. All rights reserved, Built with
in India


